
Figure 3.
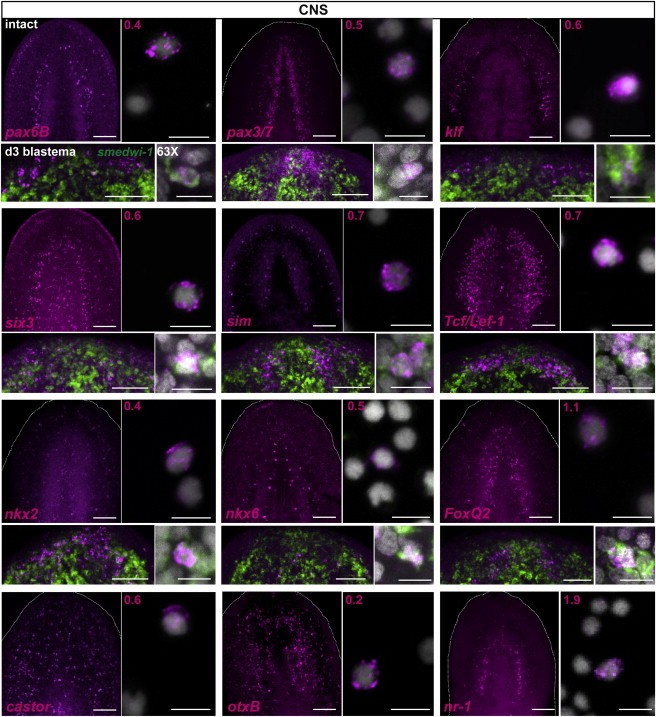
A Broad Panel of CNS-Associated Transcription Factors Was Expressed in X1 Neoblasts
For each gene tested (except last row), the left upper panel shows the expression of the transcription factor (magenta) in the intact head (scale bars, 100 μm), the right upper panel shows expression in sorted X1 cells from prepharyngeal regions of amputated animals 48 hr after wounding (scale bars, 10 μm), the left bottom panel shows the expression of the transcription factor and smedwi-1 (green) in day 3 regenerating anterior blastemas (scale bars, 100 μm), and the bottom right panel shows a higher magnification of a cell coexpressing the transcription factor (magenta) and smedwi-1 (green) in the regenerating blastema (scale bars, 10 μm). DAPI labeled DNA (gray). Percentages of X1 cells expressing the transcription factors are shown in the upper left corner. Numbers of X1 cells counted: pax6B n = 10/2302, pax3/7 n = 12/2299, klf n = 15/2746, six3 n = 11/1826, single minded (sim) n = 1/150, Tcf/Lef-1 n = 3/432, nkx2 n = 9/2435, nkx6 n = 2/395, FoxQ2 n = 2/180, castor n = 11/1954, otxB n = 4/2111, and nr-1 n = 31/1637. Images shown are maximal-intensity projections. Anterior, up.