
Figure 4.
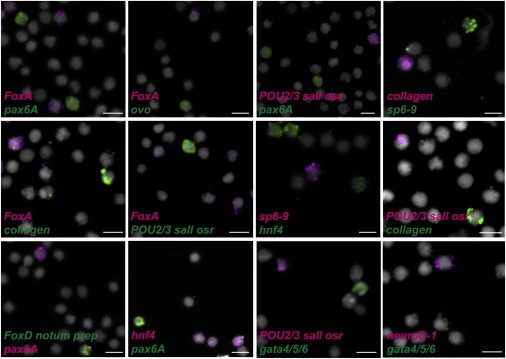
Nonoverlapping Expression of Different Tissue-Associated Genes in X1 Neoblasts
Cell FISH from sorted X1 cells from prepharyngeal regions 48 hr following amputations using several combinations of genes expressed in different tissues. Pharynx: FoxA; CNS: pax6A, neuroD-1, and sp6-9; eye: ovo and sp6-9; protonephridia: POU2/3, sall, osr; muscle: collagen; anterior pole: FoxD, notum, prep, and gut: hnf4 and gata4/5/6. No overlapping expression within the same X1 cells was detected (paired t test one-tailed, p = 0.0064) when compared to expected frequencies. Total number of X1 cells counted: FoxA/pax6A n = 693, FoxA/ovo n = 198, POU2/3/sall/osr/pax6A n = 489, FoxD/prep/notum/pax6A n = 255, collagen/sp6-9 n = 198, collagen/FoxA n = 443, FoxA/POU2/3/sall/osr n = 295, hnf4/sp6-9 n = 448, collagen/POU2/3/sall/osr n = 427, hnf4/pax6A n = 216, POU2/3/sall/osr/gata4/5/6 n = 2422, neuroD-1/gata4/5/6 n = 201. DAPI labeled DNA (gray). Images shown are maximal-intensity projections. Scale bars, 10 μm.