
Figure 3.
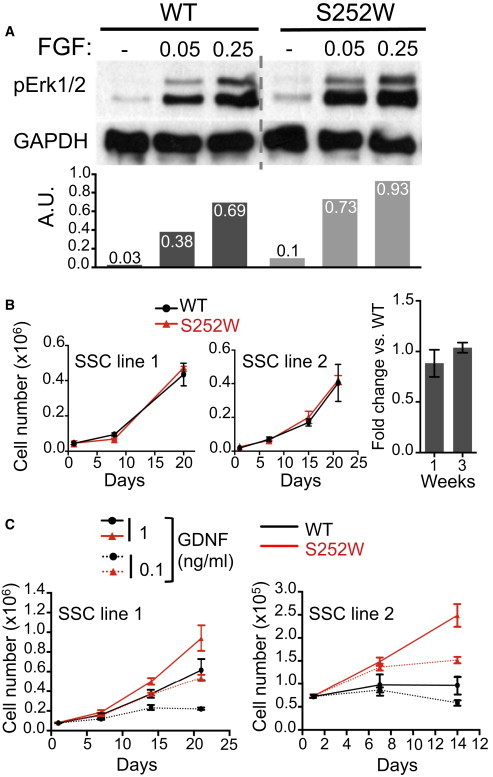
Enhanced Sensitivity of S252W SSCs to FGF
(A) Representative anti-p42/44 MAPK (pErk1/2) IB in WT and S252W SSCs in response to FGF2 doses (0.05 and 0.25 ng/ml). Grey dashed line denotes cropped lane. Graphs correspond to densitometric analyses of IB image above for pErk1/2, normalized to loading control (GADPH), with values shown for each condition in arbitrary units (A.U.).
(B and C) Proliferation curves showing WT and S252W SSC numbers (mean ± SD; n = 3 wells/condition) after 2–4 weeks in vitro with either (B) reduced FGF2 (1 ng/ml) or (C) reduced GDNF (doses shown) and reduced FGF2 (1 ng/ml). Curves correspond to two biological replicates. Bar graph in (B) depicts fold change in total cell number of S252W versus WT SSCs at indicated time points in three biological replicates (mean ± SD).
See also Figure S2.