
Figure 4.
Enhanced Stem Cell Fitness of S252W SSCs
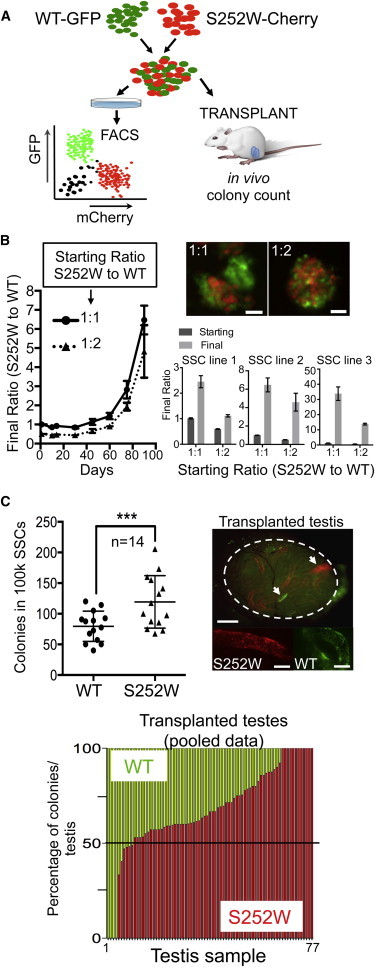
(A) Schematic of mixing experiments to assess fitness of WT versus S252W SSCs. For in vitro experiments, differentially labeled WT and mutant SSCs were mixed and cultured with different doses of FGF2. Stem cell activity was measured by transplantation into busulfan-treated mice. Two months after transplantation, the number of GFP and mCherry colonies in each testis was counted.
(B) In vitro mixing experiment showing a significant change over time in the ratio (FACS) of cocultured S252W and WT SSCs in reduced FGF2 (1 ng/ml), for both 1:1 and 1:2 starting ratios. Curves correspond to one representative biological replicate and show the mean (±SD; n = 3 wells/time point). Fluorescent images show mixed SSC colonies (scale bar, 50 μm). Bar graphs show the starting (i.e., measured postplating) and final ratios in three biological replicates. Error bars correspond to ±SD; n = 3 wells/time point.
(C) Top: representative transplantation experiment showing colony quantification for each genotype in transplanted testes (n = 14) with mixed WT-GFP and S252W-mCherry SSCs. ∗∗∗p < 0.005 (Wilcoxon matched-pairs signed rank test). Fluorescent images: a transplanted testis with WT (green) and mutant (red) colonies (arrows; dashed line denotes testis border; scale bar, 1 mm) (top image), and representative WT (green) and S252W (red) colony detail (scale bars, 200 μm) (bottom images). Bottom: pooled transplant data (n = 10 experiments, 77 testes) showing the normalized percentage of colonies of each genotype per testis.
See also Figure S3.