
Fig. 1.
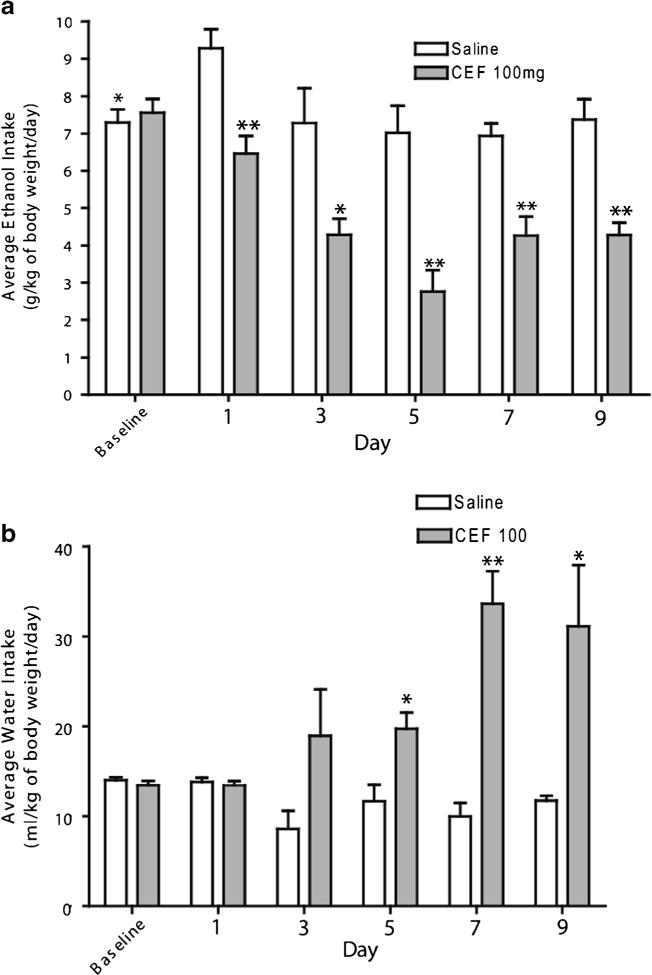
Graph represents average daily ethanol and water intake and body weight during the 9 days of ethanol re-exposure. a Daily ethanol intake of male P rats for 9 days of ethanol re-exposure, following 5 days of treatment with ceftriaxone (CEF) or saline during ethanol deprivation. (*p<0.01; **p<0.001); b daily water intake of male P rats for 9 days, following 5 days of treatment during ethanol deprivation (*p<0.05; **p<0.01). All data are expressed as mean ± SEM. Saline (ethanol saline group, n=6); CEF (ethanol CEF group at 100 mg/kg body weight, n=6)