
Figure 1.
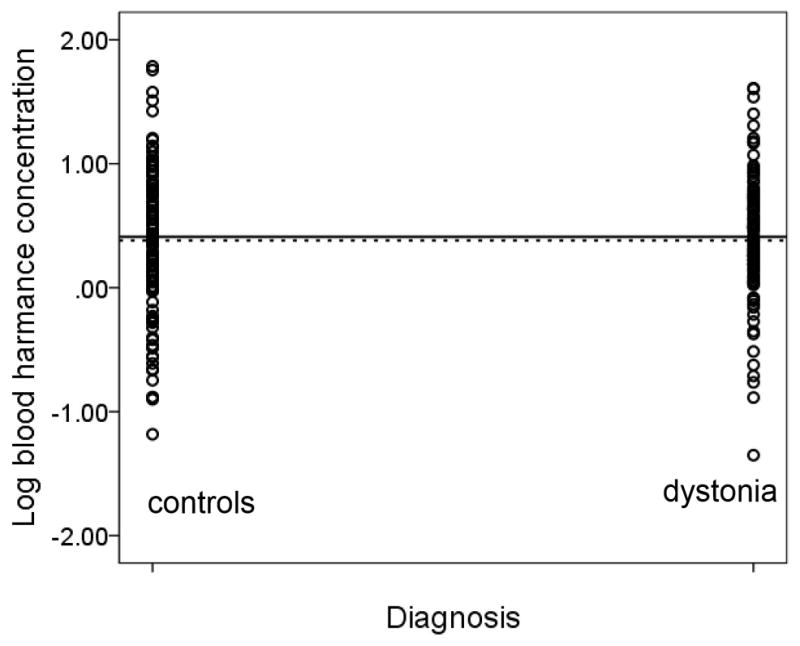
Log blood [HA] in g −10/ml in dystonia cases vs. controls. The solid horizontal line depicts the mean log blood [HA] value in dystonia cases (0.41 g −10/ml) and the dashed horizontal line depicts the mean log blood [HA] value in controls (0.38 g−10/ml).