Figure 2.

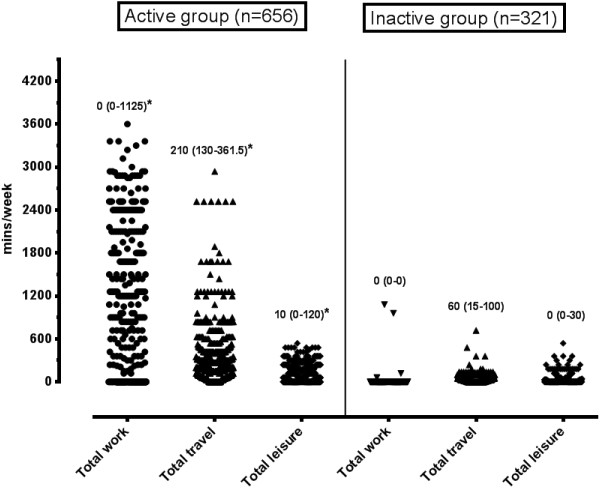
Comparative diagram of cumulative weekly physical activity in the occupation-, transport- and recreational-time between GPAQ active and GPAQ inactive groups. *p<0.05 when compared to matching physical activity domain.

Comparative diagram of cumulative weekly physical activity in the occupation-, transport- and recreational-time between GPAQ active and GPAQ inactive groups. *p<0.05 when compared to matching physical activity domain.