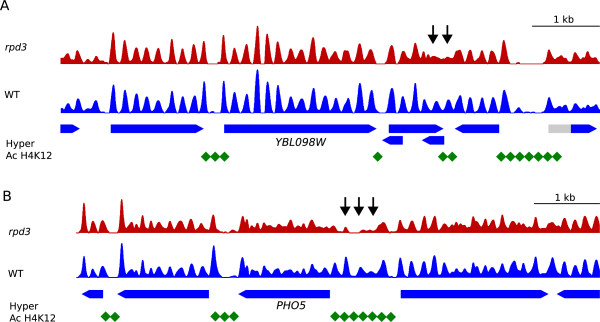
Figure 3.

Histone deacetylation in the absence of Rpd3 correlates with local modifications of nucleosome organization. (A), Nucleosome patterns across a genomic region in chromosome II from WT (blue) and rpd3Δ cells (red). Blue pointed rectangles represent genes where the coding (blue) and non-coding (grey) regions are indicated. Black arrows indicate nucleosome remodelling in the absence of Rpd3. Green diamonds represent the hyperacetilated regions in the mutant cells (Robyr et al., [31]). (B), As in B but for the PHO5 gene region.
