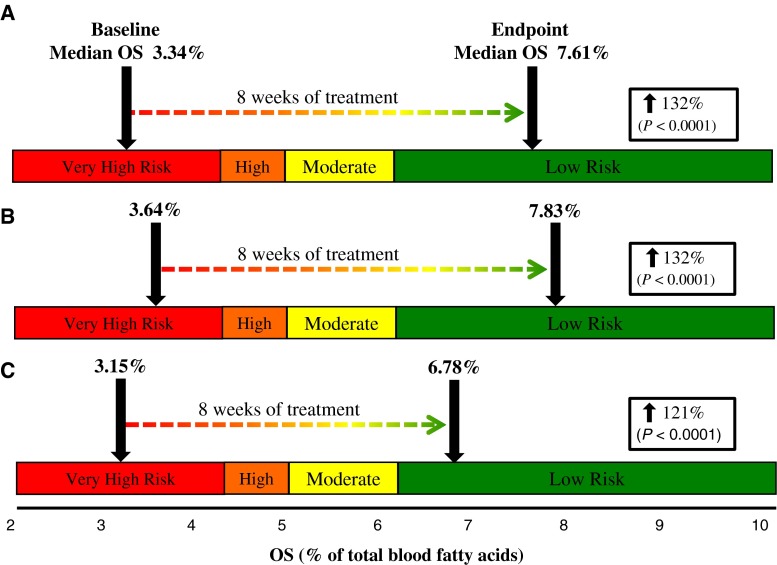
Fig. 2.
Change in blood median OS (primary endpoint) following 8 weeks of treatment with 6:1-OM3. A Total 6:1-OM3 treated (n = 56) in both Cohorts, B Cohort 1 (baseline TG 1.02–2.25 mmol/L, n = 36), and C Cohort 2 (baseline TG 2.26–5.65 mmol/L, n = 20). Percentage increases (box) represent a significant change (P < 0.0001) in placebo-adjusted median OS from baseline to week 8. Risk quartiles were adapted from previously published data [10]. For abbreviations, see text

