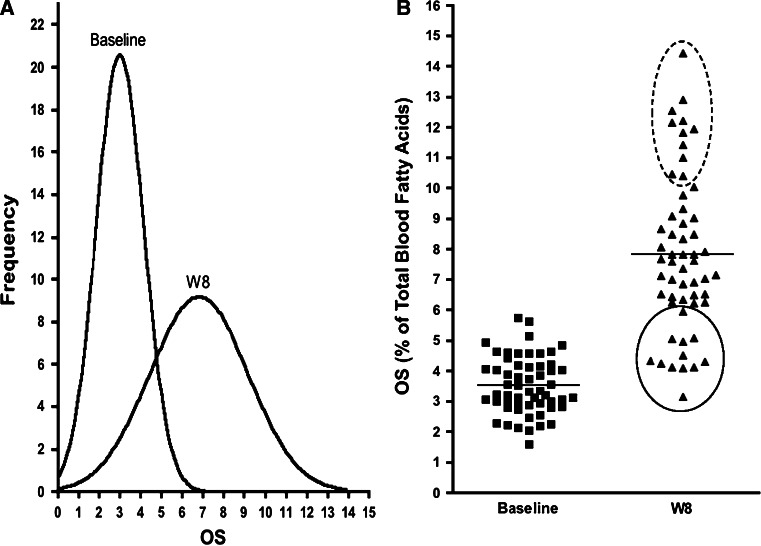
Fig. 3.
Change in OS (primary endpoint) at baseline and upon 8 weeks of treatment with 6:1-OM3 (n = 56). A Frequency distribution plot of panel B subjects with a broad distribution of OS due to weak versus strong responders. B Scatter plot of OS in 6:1-OM3 treated. Weak- and strong responders are circled with solid and dotted lines, respectively and horizontal lines at baseline and 8 week represent median values

