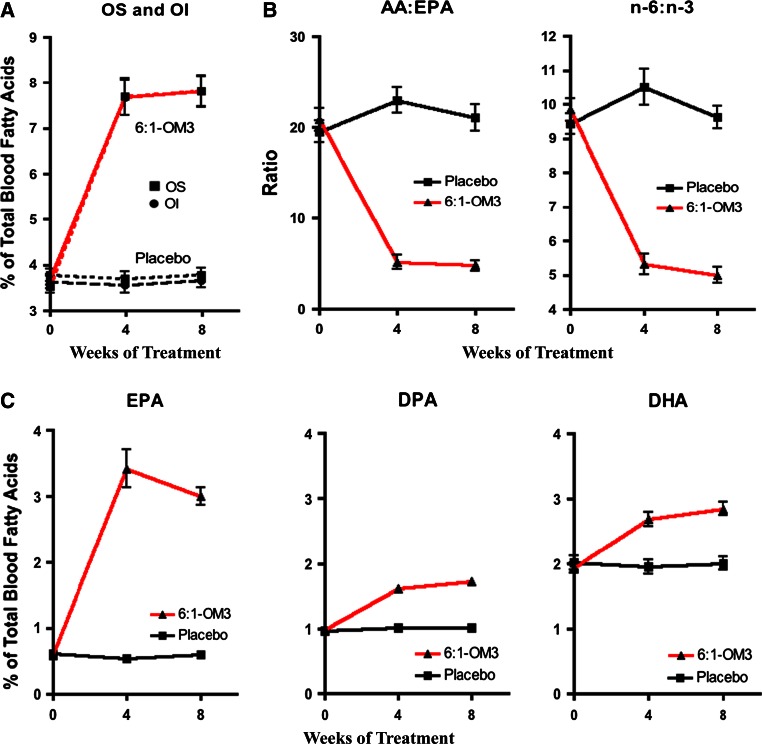
Fig. 5.
Time-course change in OS, OI, AA:EPA and n-6:n-3 ratios, and in individual LC n-3 PUFA components (n = 56) in both Cohorts upon 8 weeks of treatment with 6:1-OM3 and with placebo. A Changes in OS and OI. B Changes in inflammatory indicators, and C Changes in individual blood EPA, DPA, and DHA levels. All changes were significant (P < 0.0001) following 4 and 8 weeks of treatment. For abbreviations, see text

