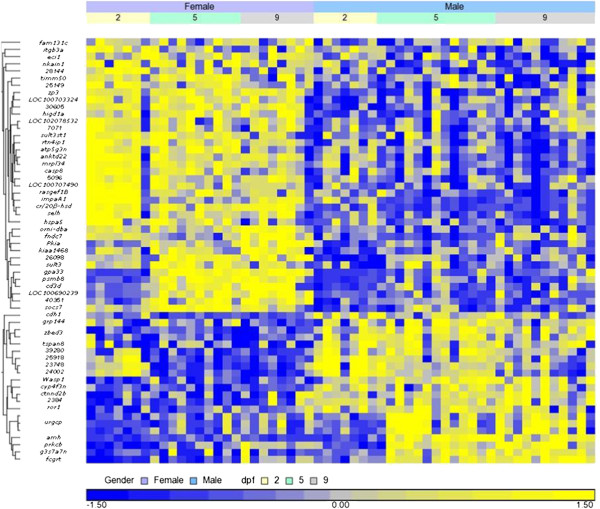
Figure 2.

Clustering of differentially expressed genes by gender and dpf. Fifty nine differentially expressed genes between males and females at 2, 5 and 9 dpf, at false discovery rate of p < 0.05, were clustered. The Z-score represents the number of standard deviation units of genes’ expression value from the mean (defined as 0). Blue and yellow colors indicate up and down expression, respectively. Vertical bars represent the clustering of genes based on expression profiles. urgcp and zbed3 genes appear more than once and represent different probes at multiple locations in the genome. Probe numbers begin with the prefix “CUST_”. Annotations of probes are presented in Additional file 1: Table S1. LOC numbers are NCBI IDs.
