
Figure 3.
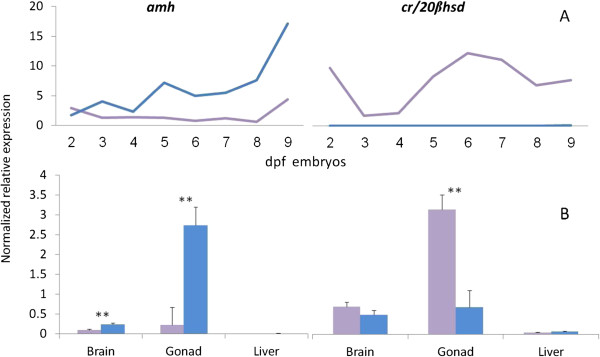
amh and cr/20β-hsd normalized relative expression. Gene expression by qPCR is presented for males (blue) and females (purple) in 2 to 9 dpf embryos (A), and in brain, testis/ovary and liver at 75 dpf (B). Deviation bars represent standard errors and asterisks represent the level of significance for sex-specific expression differences: **p ≤ 0.001.