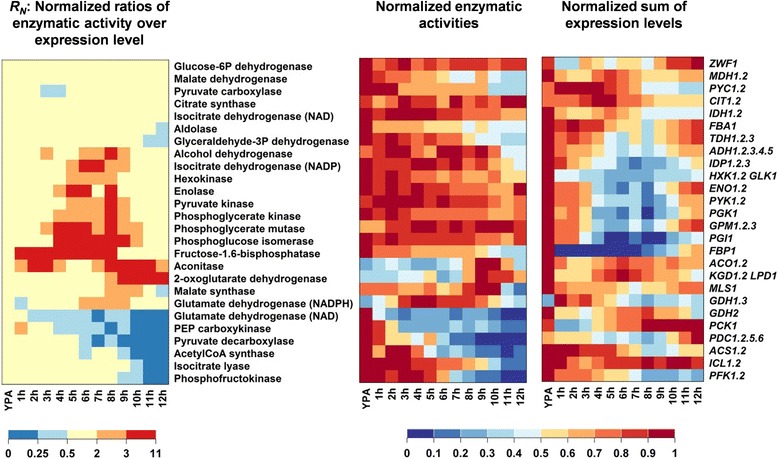
Figure 2.

Comparison of enzymatic activities and expression levels of the corresponding genes in sporulating cells. Enzymes were grouped according to similar correlations between activity and transcription strength. Columns correspond to time points after transfer from YPA to sporulation medium. Each row corresponds to an enzymatic activity summarizing (left panel) the normalized ratio between enzymatic activity and the corresponding transcript levels, (middle panel) the normalized enzymatic activity, and (right panel) the normalized sum of the linearly scaled transcript levels. The ratios of activity over expression level were normalized to the corresponding ratio observed in YPA medium according to Equations 1 and 2. Expression levels and enzymatic activities were normalized to their maximum values observed over the whole time course. Data represent the average of at least two independent experiments.
