
Figure 2.
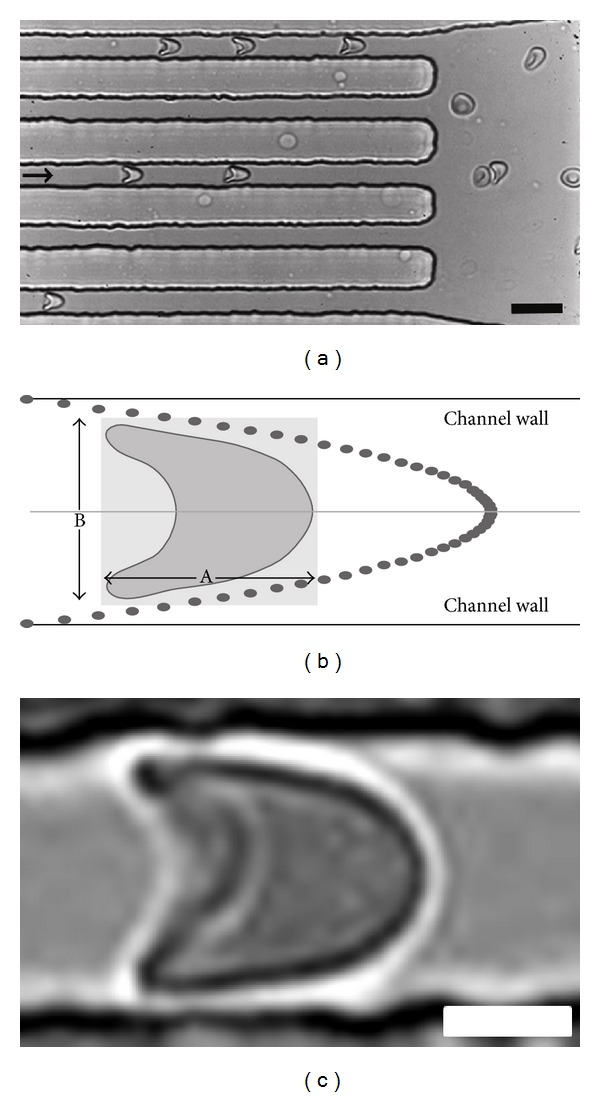
Flow of RBCs in microchannels. (a) RBCs flowing inside and just outside microchannels. The arrow indicates the direction of the flow. Scalebar: 15 μm. (b) Deformation of the cell is determined in a virtual box with length (A) and width (B) and is expressed by the deformation index (DI), that is, the ratio between the length and width (A/B). Dots indicate the parabolic flow profile within the microfluidic channels. (c) Deformed single RBC flowing within the 7 μm channel showing a bullet-like shape. Scalebar: 3 μm.