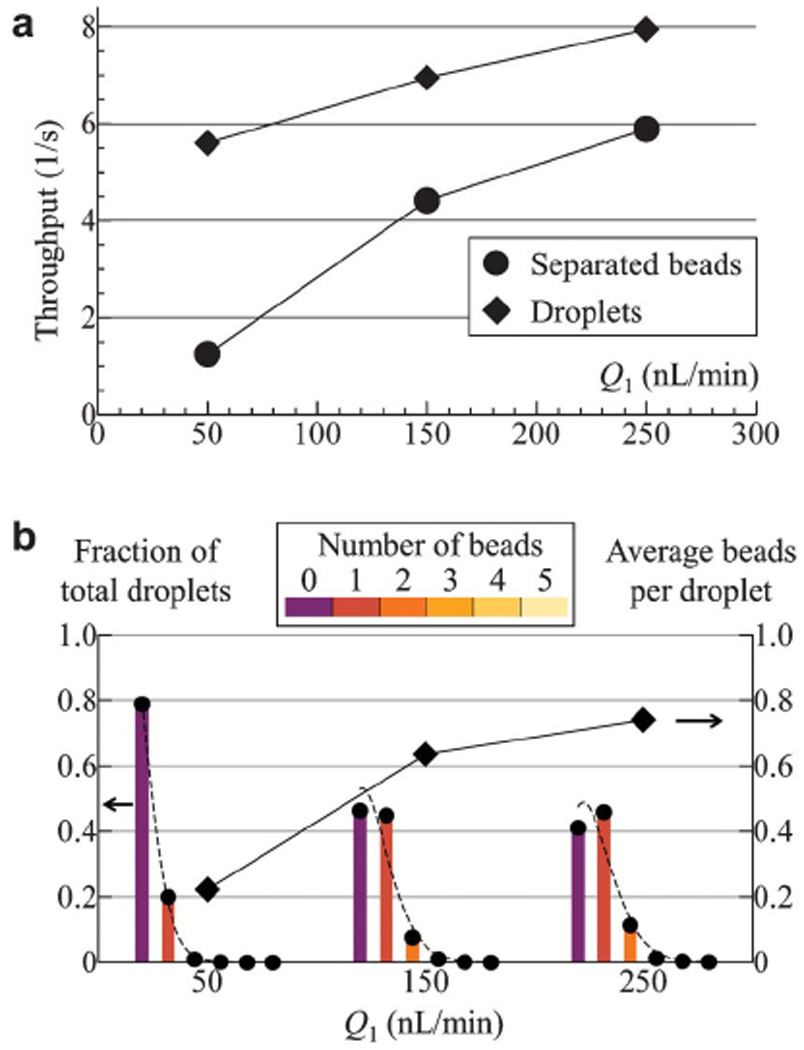
Fig. 4.

Quantification of the encapsulation characteristics with 7.9 µm diameter magnetic beads. (a) Separated bead (filled circles) and droplet (filled diamonds) throughputs as a function of input flow rate Q1. Other experimental parameters are kept fixed at H1 = 100 Oe, f = 5 Hz and Q4 = 2Q3 = 30 nL/min. (b) Extracted from the same experiment as in (a), fraction of droplets (corresponding to the left vertical axis) containing various number of beads are plotted as dots with underlying color-coded bars at flow rates Q1 = 50, 150 and 250 nL/min. Dashed curves at each Q1 represent Poisson distribution function (Equation (2)) with mean value λ set by the measured average number of beads per droplet (plotted as filled diamonds with values corresponding to the right vertical axis). Total number of droplets taken into account ranges from 840 to 1251, and an estimate on the statistical deviation due to finite sample size is ~8401/2/840 = 3.5%.
