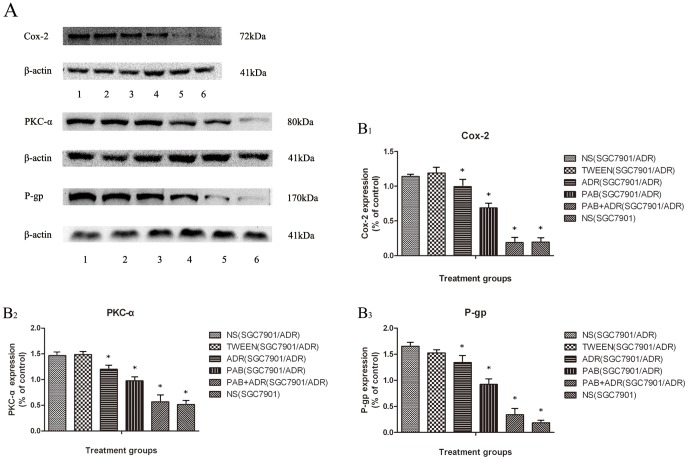
Figure 5. Inhibitory effects of PAB on expressions of Cox-2, PKC-α and P-gp in tumor tissues.
A: representative immunoblots of Cox-2, PKC-α, P-gp compared with β-actin in different treatment groups. (lane 1): NS control group (SGC7901/ADR) (lane 2): TWEEN control group (SGC7901/ADR) (lane 3): ADR group (SGC7901/ADR) (lane 4): PAB group (SGC7901/ADR) (lane 5): PAB+ADR group (SGC7901/ADR) (lane 6): NS control group (SGC7901). B: relative expression levels of Cox-2 (B1), PKC-α (B2), and P-gp (B3) in different treatment groups. The tumors were isolated and homogenized to measure the protein level, and β-actin was used as an internal control. Each immunoblot was representative of three distinct experiments with similar results. *p<0.05 vs control group.

