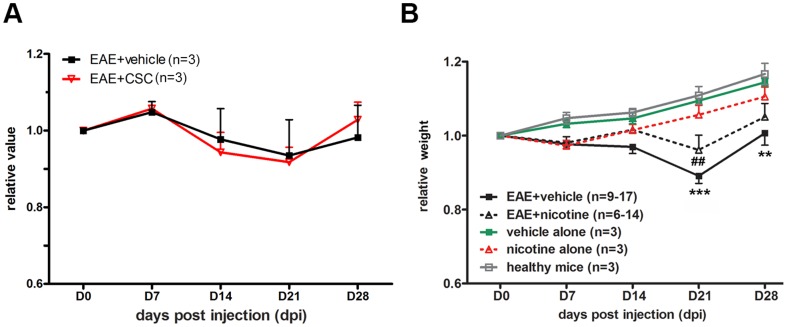
Figure 2. Weight changes of CSC- or nicotine-treated EAE animals.
Weight changes were recorded and compared between vehicle (DMSO, n = 3 at all time points) and CSC- (A) or nicotine-treated (B) mice. In (B), * denote significance compared to mice treated with vehicle (saline) alone (n = 3 at all time points). #: significance compared to mice treated with nicotine alone (n = 3 at all time points). Weights were plotted as a ratio over day 0 weights. (*** p<0.001; **p<0.01; ##p<0.01). On day 28 there were n = 9 mice in the EAE+vehicle group and n = 6 in the EAE+nicotine group. On day 21 there were n = 12 mice in the EAE+vehicle group and n = 11 in the EAE+nicotine group. On days 0, 7 and 14 there were n = 17 mice in the EAE+vehicle group and n = 14 in the EAE+nicotine group.

