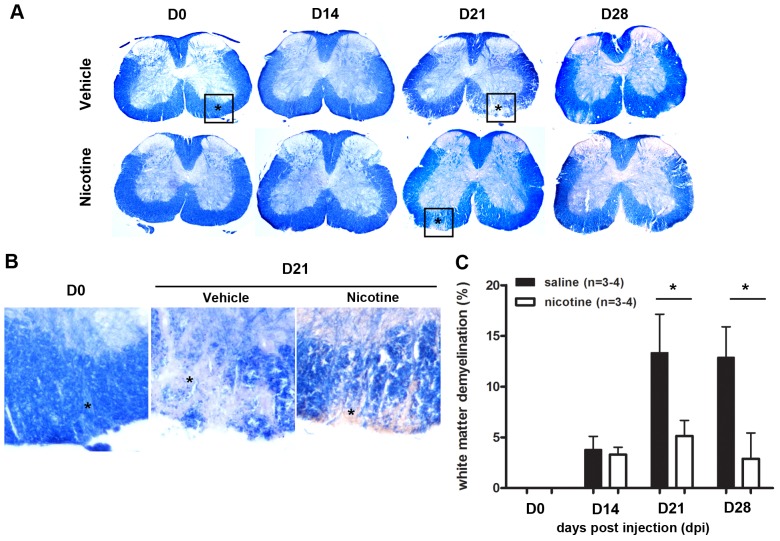
Figure 3. Decreased demyelination in nicotine-treated mice during EAE.
(A) Frozen sections of spinal cords were isolated from vehicle (saline) and nicotine-treated mice at different time points during EAE. Eriochrome cyanine (EC) was used to visualize demyelination. Intact white matter (WM) is indicated by the blue staining and demyelination is revealed by diminished color. Areas of demyelination are indicated by asterisks; boxed regions are shown at higher magnification. (B) Demyelinated areas were measured using ImageJ and calculated based on equation listed in Methods. (n = 3–4, *p<0.05).

