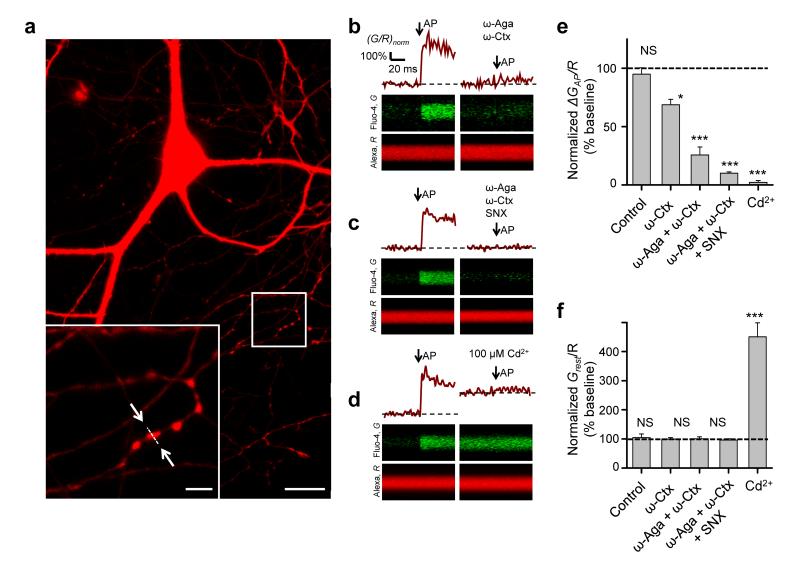
Figure 2.
Relative contributions of P/Q-, N-, and R-type VGCCs to presynaptic Ca2+ dynamics assessed with fast Ca2+ fluorescence imaging. (a) Fluorescence image of a typical cultured hippocampal neuron loaded with AlexaFluor 568 and Fluo-4 (Alexa channel is shown). Bottom left: magnified image of axonal fragment containing several presynaptic boutons; arrows indicate position of the line-scan used to measure Ca2+ transients illustrated in (b). Scale bars 20 μm and 4 μm. (b–d) Line-scan fluorescence responses to a single action potential (average of 5 sweeps) in typical boutons from representative experiments before (left) and after (right) application of different VGCC blockers as indicated. (e, f) Summary graphs illustrating differential effects of organic VGCC blockers and Cd2+ on action potential-evoked (e) and resting (f) presynaptic Ca2+ fluorescence (mean ± s.e.m, N = 9 (Control), N = 7 (ω-Ctx), N = 18 (ω-Aga + ω-Ctx), N = 40 (ω-Aga + ω-Ctx + SNX) and N = 13 (Cd2+) boutons from 4–6 independent experiments for each condition. Stability of Ca2+ responses in control experiments was tested after the same duration as for VGCC blockers. * P < 0.05, *** P < 0.001, NS P > 0.3, Wilcoxon signed rank test for single group median.

