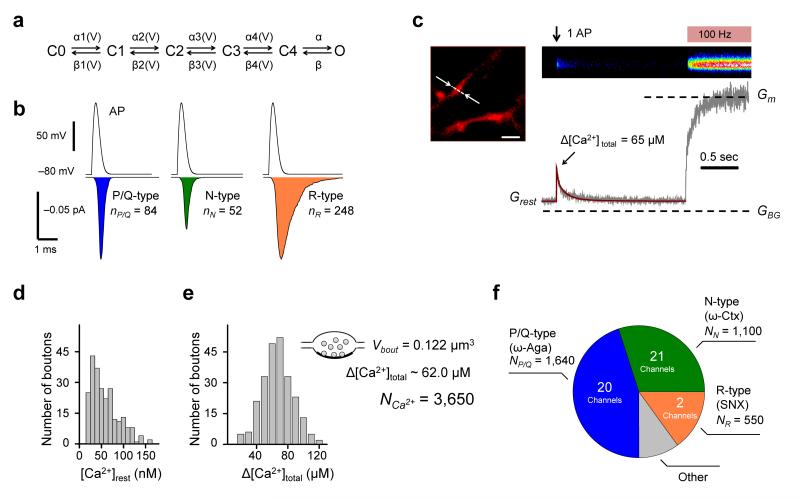
Figure 5.
Estimation of the numbers of P/Q-, N-, and R-type VGCCs in an average presynaptic bouton. (a) Gating model for presynaptic VGCCs. (b) Average (500 simulations) action potential-evoked current traces (including failures) through P/Q-, N-, and R-type channels. Action potential waveform is shown above. Integration of the current traces (colored areas) yields estimates for the average number of Ca2+ ions entering the bouton following an action potential through single VGCCs of each subtype. (c) Representative Ca2+ imaging experiment. Top left, an axonal fragment loaded with Fluo-4 and AlexaFluor 568 (Alexa channel is shown), arrows indicate line-scan position, scale bar 2 μm. Top right, average of 5 line-scan Fluo-4 responses to a single spike followed by a saturating 100 Hz spike-train (brightness is color-coded). Bottom right, corresponding fluorescence time-course. Dashed lines, background (GBG) and maximal (Gm) Fluo-4 fluorescence. Brown curve, non-stationary single compartment model fit corresponding to Δ[Ca2+]total = 65 μM. (d, e) Distribution of [Ca2+]rest (d) and Δ[Ca2+]total (e) in 242 boutons from 12 axons. Insert in (e), the number of Ca2+ ions (NCa2+ ~3,650) entering a bouton of volume Vbout ~0.122 μm3 during action potential corresponding to the average Δ[Ca2+]total = 62.0 μM (see text for details). (f) Pie-chart illustrating the complement of presynaptic VGCCs in an average presynaptic bouton. The colored areas correspond to the fractions of spike-evoked Ca2+ influx mediated by ω-Aga-sensitive P/Q-type VGCCs (blue, 45%), ω-Ctx-sensitive N-type channels (green, 30%) and SNX-sensitive R-type channels (brown, 15%) as determined in Fig. 2e, together with the corresponding numbers of VGCCs.

