Figure 6.
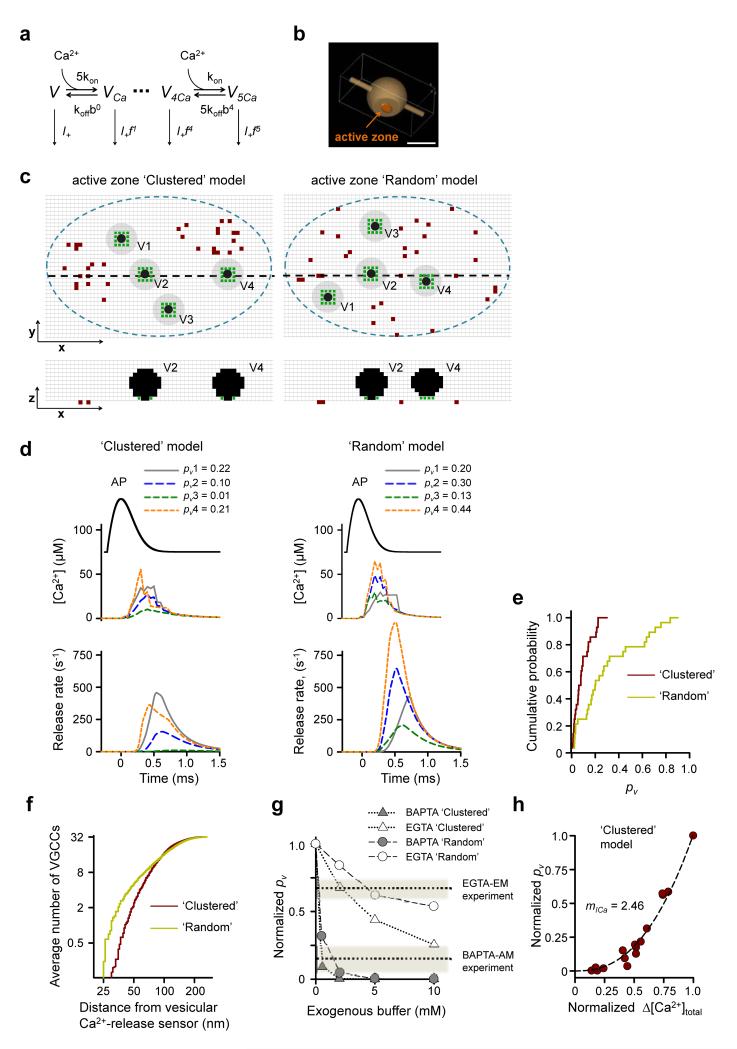
Modeling action potential-evoked release in small hippocampal synapses. (a) Allosteric model of Ca2+ activation of vesicle fusion19. (b) Presynaptic bouton geometry used in VCell simulations. Scale bar 0.5 μm. (c) Representative distributions of VGCCs and vesicles in the active zone for Clustered (left) and Random (right) models. Top, XY cross-sections 2.5 nm above the active zone; bottom, XZ cross-sections corresponding to black dashed lines in the XY plane. Blue dashed lines, active zone borders; brown dots, VGCCs; black dots, space occupied by vesicles; gray circles, vesicle projections on the XY plane; green dots, locations of Ca2+-release sensors, grid 5 nm. (d) Simulation results corresponding to geometries in (c). Top, action potential waveform; middle, average [Ca2+] transients at Ca2+-release sensors; bottom, corresponding release rates; legends, resulting fusion probabilities pv. (e) Cumulative probability plots of pv for Clustered and Random models. (n = 28 vesicles from 7 simulated synapses for each model). (f) Cumulative probability plots showing the average number of VGCCs located within a given distance from the vesicular Ca2+-release sensors (n = 240 vesicles from 60 simulated synapses). (g) Model predictions for inhibition of evoked release by BAPTA and EGTA. Dotted lines show the experimental effects of BAPTA-AM and EGTA-AM as determined in Fig. 4e. (h) Dependency of pv on Δ[Ca2+]total simulated by progressive deletion of active VGCCs. Data are from 5 simulated synapses, each point represents average pv for 4 release-ready vesicles. Data on both axes are normalized to the corresponding maximal values at basal conditions. Dotted lines, fitted power function, with the slope corresponding to Ca2+ current cooperativity mICa = 2.46.

