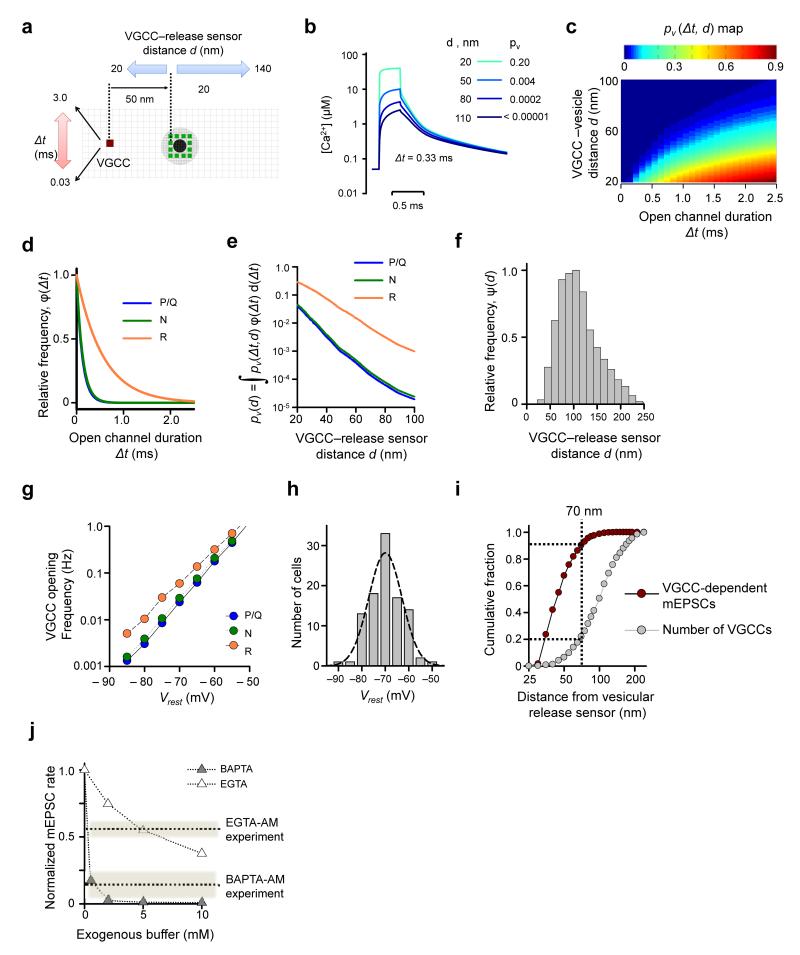
Figure 7.
Modeling VGCC-dependent glutamate miniature release. (a) Schematics illustrating VCell simulations. As in Fig. 6c the black dot indicate space taken up by the vesicle in the XY plane 2.5 nm above the active zone; gray circle, vesicle projection on the active zone plane; green dots, assumed positions of Ca2+-release sensors, grid 5 nm. (b) Examples of average [Ca2+] transients at release sensors produced by single VGCC openings (for 0.33 ms) for 4 different VGCC-release sensor distances. Insert, corresponding vesicle fusion probabilities. (c) Color-coded map showing dependency of vesicle fusion probability pv(Δt,d) on VGCC-vesicle distance d and VGCC open-channel duration Δt. (d) Frequency histograms φ(Δt) for the durations of spontaneous P/Q-, N-, and R-type channel opening at Vrest obtained using the VGCC gating model12 (Fig. 5a). (e) Dependencies of vesicle fusion probability pv(d) on VGCC-vesicle distance for different VGCC subtypes. (f) Frequency histogram ψ(d) for the relative VGCC-vesicle distances in the Clustered model (n = 60 simulated active zones). (g) Dependency of spontaneous P/Q-, N-, and R-type channel opening on Vrest, calculated using the six-state VGCC gating model12 (Fig. 5a). (h) Distribution of Vrest in cultured hippocampal neurons (mean 71.9 ± 0.7 mV, n = 98 neurons). (i) Cumulative fractions of VGCC-mediated mEPSCs and VGCC numbers plotted as functions of the distance from the vesicular release sensor. ~90% of all VGCC-dependent minis are mediated by only ~20% of all VGCCs present in the active zone located within 70 nm of docked vesicles. (j) Model predictions for the effects of BAPTA and EGTA on VGCC-dependent mEPSC frequency. Dotted lines, experimental effects of BAPTA-AM and EGTA-AM as estimated in Fig. 4e.

