
Figure 2.
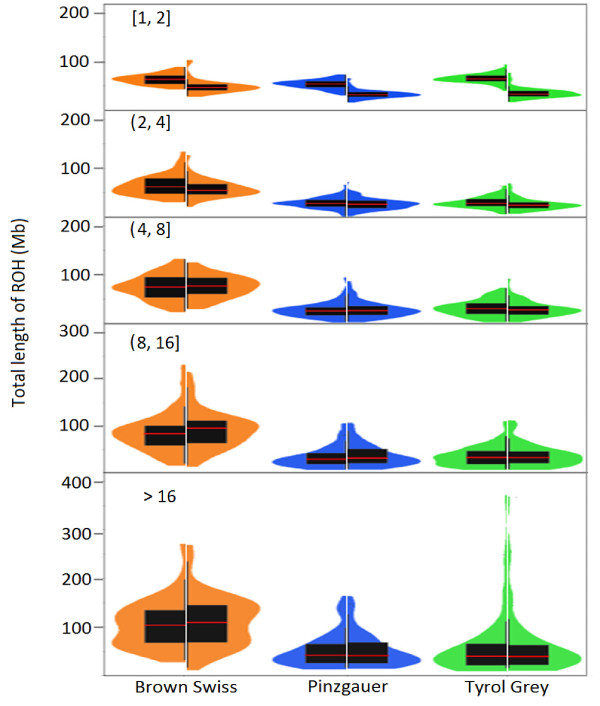
Overlay of box plots and kernel density plots. Overlay of box plots and kernel density plots that show the distribution of the total ROH length among all Brown Swiss bulls (orange), Pinzgauer bulls (blue) and Tyrol Grey bulls (green) for five ROH length categories; box plots (black) are shown inside the density plots, and horizontal red lines indicate mean values; the left half of each density and box plot was obtained from the 50 k panel data, while the right half was obtained from the HD panel data.