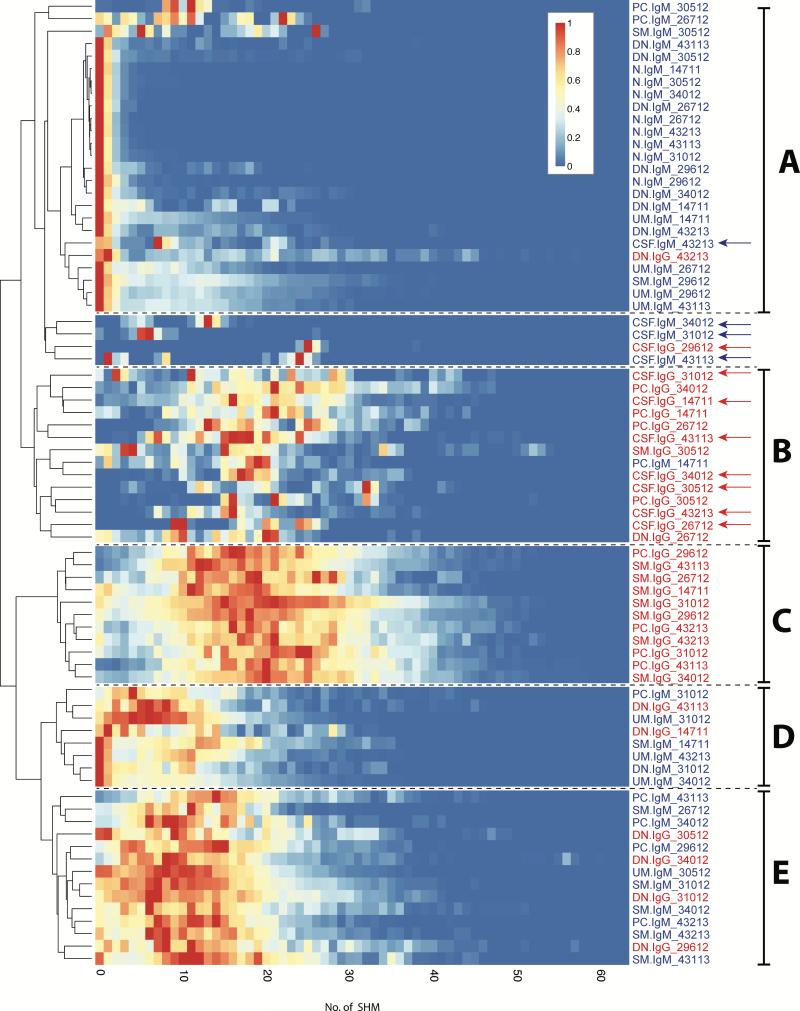
Figure 4. Dendogram and heatmaps of PB B cell and CSF Ig-VH SHM profiles.
Shown are heatmaps of Ig-VH SHM profiles; each row represents a PB B cell subset or CSF as indicated by row titles on the right. IgM are in blue type, IgG are in red type; CSF samples are indicated by arrows. Within each subset or CSF sample, SHM profiles were scaled to the highest peak set at 1.0 and colors assigned such that a count of 0 non-redundant sequences with a certain umber of SHM resulted in blue color and the highest number of sequences with an indicated number of SHM was labeled red; the coloring scale is shown in the upper right. PB B cells subsets or CSF samples clustering together based on SHM profile-similarity are indicated by letters on the right (see also Results). A: Group of subsets characterized by predominantly low SHM, including all naïve B cells and nearly all IgM+ DN B cells. B and C: Groups of subsets characterized by extensive SHM, and containing all IgG-expressing SM B cells and plasma cells, and the majority of CSF samples. D and E: Subsets characterized by SHM lower than B and C, but higher than A; these groups include mainly IgM-expressing subsets and IgG-expressing DN B cells. The data used to generate these heatmaps is shown in Table S8.

