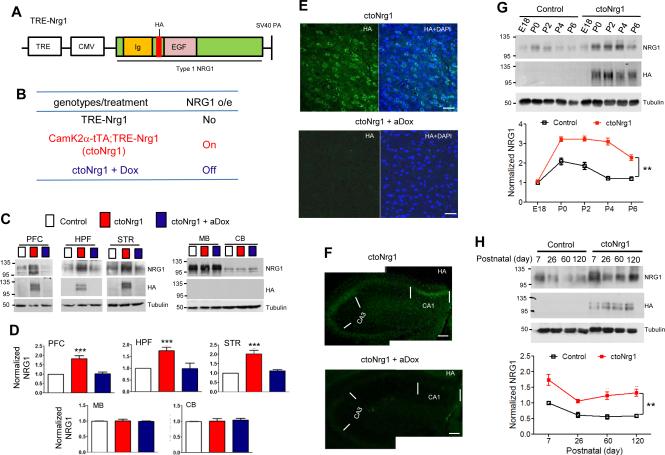
Figure 1. Temporal control of NRG1 expression in forebrains of ctoNrg1 mice.
(A) Transgene structure. Full length NRG1 type I β1a was cloned in pMM400 between the promoter complex of TRE and CMV (cytomegalus virus minimal promoter) and SV40 polyadenylation signal.
(B) Genotypes and NRG1 expression. Unless otherwise indicated, blank, red and blue histograms/curves in the paper represent data from control, ctoNrg1, and aDox-treated ctoNrg1 mice, respectively. aDox, Dox treatment in adulthood; dDox, Dox treatment during development (see Figure 7); o/e, overexpression.
(C) Expression of NRG1 transgene in PFC, hippocampus (HPF), and striatum (STR), but not midbrain (MB) and cerebellum (CB). ctoNrg1 mice, 8 weeks of age, were treated with Dox for two weeks. Homogenates of various brain regions of indicated mice were subjected to western blot analysis with indicated antibodies.
(D) Quantification of NRG1 expression in different brain regions. Expression in ctoNrg1 samples were normalized by those from control littermates. n = 3 per genotype; *** p < 0.001 for PFC, HPF and STR, one-way ANOVA.
(E) HA staining in ctoNrg1 PFC. Sections were stained with anti-HA antibody and DAPI. Bar, 50 μm.
(F) HA staining in ctoNrg1 hippocampus. Sections were stained with anti-HA antibody. Bar, 100 μm.
(G, H) NRG1 expression of developing forebrains. Top, representative western blots; bottom, quantitative analysis. n = 3 per genotype at each time point. Data were normalized by NRG1 levels of E18 control mice (in G) or of P7 control mice (in H). In G, ** Genotype F (1, 20) = 184, p < 0.01, two-way ANOVA. In H, ** Genotype F (1, 16) = 33.03, p < 0.01, two-way ANOVA.

