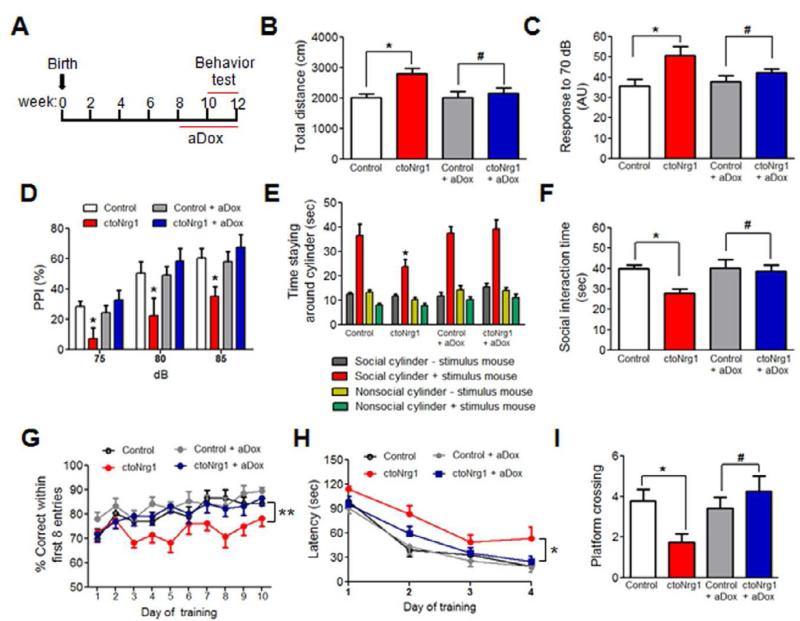
Figure 2. Behavioral deficits in ctoNrg1 mice were attenuated after aDox treatment.
(A) Diagram of aDox treatment and behavioral test. Dox was added in the drinking water when mice were 8 weeks old and during entire behavioral tests, which started two weeks after treatment.
(B) Travel distance in open field was increased in ctoNrg1 mice, compared to controls, but became similar between the genotypes after aDox treatment. n = 12 per group; * p < 0.05, # p > 0.05, one-way ANOVA. Blank, red, grey and blue histograms/curves represent data from control, ctoNrg1, aDox-treated control and aDox-treated ctoNrg1 mice.
(C) Elevated response to 70dB background noise in ctoNrg1 mice, compared to controls, and the elevation was ameliorated by aDox treatment. AU, arbitrary units. n = 9 per group; * p < 0.05, # p > 0.05, one-way ANOVA.
(D) PPI was impaired in ctoNrg1 mice, compared to controls, and the impairment was diminished after aDox treatment. n = 9 per group; * Genotype F (3, 84) = 10.2, p < 0.05, two-way ANOVA.
(E) ctoNrg1 mice spent less time with social cylinder with stimulus mouse, compared to controls, and the interaction time was similar between two genotypes after aDox treatment. n = 12 per group; * Genotype F (3, 172) = 7.01, p < 0.05, two-way ANOVA.
(F) Social interaction time with stimulus mice without cylinder was reduced in ctoNrg1 mice, and the reduction was diminished after aDox treatment. n = 12 for each group; * p < 0.05, # p > 0.05, one-way ANOVA.
(G) Decreased correct entries in ctoNrg1 mice, compared to controls, and the difference was diminished after aDox treatment. n = 12 per group; ** Genotype F (3, 424) = 16.14, p < 0.01, two-way ANOVA.
(H) Increased latency for ctoNrg1 mice to reach the hidden platform in MWM, compared to controls, and the two genotypes showed similar latency after aDox treatment. n = 9 for control, n = 8 for ctoNrg1, n = 8 for both groups of control + aDox and ctoNrg1 + aDox; * Genotype F (3, 87) = 6.4, p <0.05, two-way ANOVA.
(I) Reduced platform crossing by ctoNrg1 mice in MWM probe test, compared to controls, and the two genotypes showed similar platform crossing after aDox treatment. n = 9 for control, n = 8 for ctoNrg1, n = 8 for both groups of control + aDox and ctoNrg1 + aDox; * p < 0.05, # p > 0.05, one-way ANOVA.

