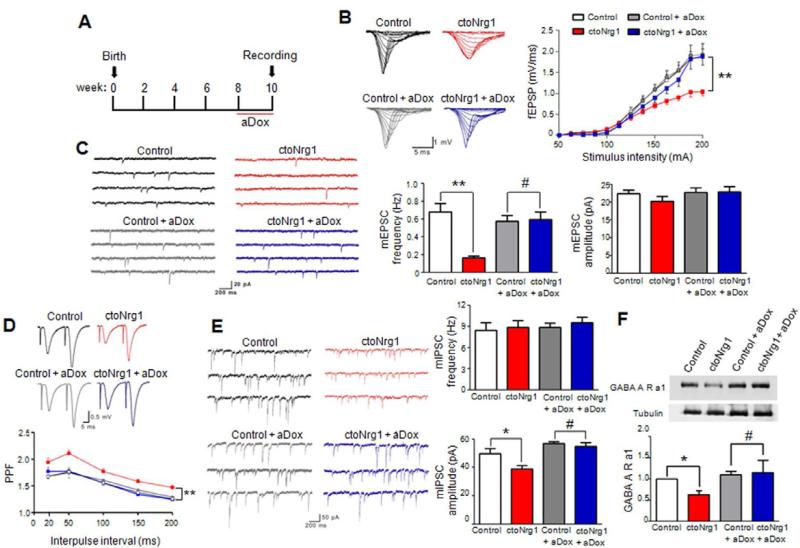
Figure 3. Glutamatergic and GABAergic impairment in ctoNrg1 mice was reduced after aDox treatment.
(A) Diagram of aDox treatment and behavioral test. Mice were fed with Dox-containing drinking water at 8 weeks old for 2 weeks before recording. Dox was kept in the slice perfusion solution.
(B) Depressed I/O curves in ctoNrg1 mice, compared to controls, and I/O curves were similar between the genotypes after aDox treatment. Left, representative traces of fEPSPs at SC-CA1 synapses at different stimulus intensities; right, I/O curves of four groups. n = 10 slices from 6 control mice, n = 10 slices from 6 ctoNrg1 mice, n = 9 slices from 4 aDox-treated control mice, n = 8 slices from 4 aDox-treated ctoNrg1 mice; ** Genotype F (3, 429) = 19.87, p < 0.01, two-way ANOVA.
(C) Reduced mEPSC frequency in ctoNrg1 CA1 pyramidal neurons, compared to controls and mEPSC frequency was similar between the two genotypes after aDox treatment. Left, representative mEPSC traces; right, quantitative data. n = 10 cells from 4 mice per group; ** p < 0.01, # p > 0.05, one-way ANOVA.
(D) Elevated PPF in ctoNrg1 SC-CA1 synapses, compared to controls and the PPF was similar between the two genotypes after aDox treatment. Top, representative traces; bottom, quantitative data. n = 10 slices from 6 control mice, n = 10 slices from 6 ctoNrg1 mice, n = 8 slices from 4 aDox-treated control mice, n = 8 slices from 4 aDox-treated ctoNrg1 mice; *** Genotype F (3, 201) = 29.76, p < 0.001, two-way ANOVA.
(E) Attenuated mIPSC amplitudes in ctoNrg1 CA1 pyramidal neurons, compared to controls and mIPSC amplitudes were similar between the two genotypes after aDox treatment. Left, representative mIPSC traces; right, quantitative data. n = 11 cells from 5 control mice, n = 10 cells from 4 ctoNrg1 mice, n = 11 cells from 5 aDox-treated control mice, n = 10 cells from 4 aDox-treated ctoNrg1 mice; * p < 0.05, # p > 0.05, one-way ANOVA.
(F) Reduced GABAA receptor α1 subunit (GABAARα1) in ctoNrg1 forebrain and the reduction was diminished after aDox treatment. Top, representative blots; bottom, quantitative data. Data from other three groups were normalized by control. n = 3 per group; * p < 0.05, # p > 0.05, one-way ANOVA.

