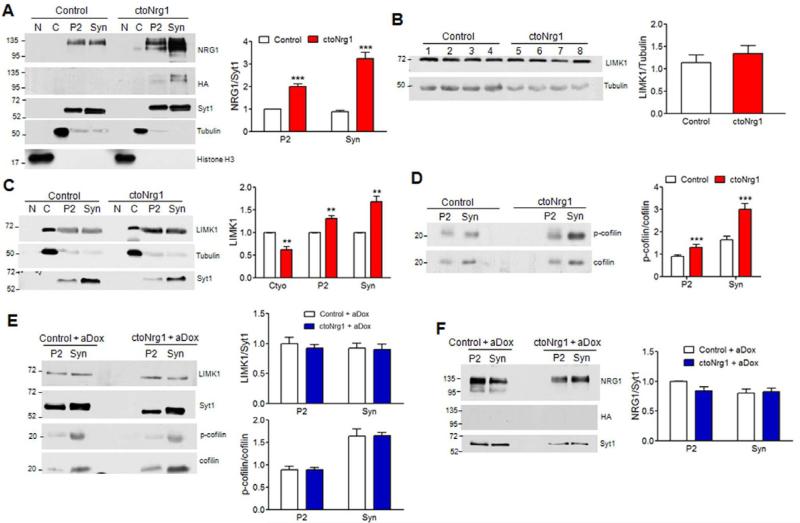
Figure 5. Synaptic recruitment and activation of LIMK1 by overexpressed NRG1.
(A) NRG enrichment in P2 and synaptosomes in ctoNrg1 forebrains. Subcellular fractions were subjected to western blotting with indicated antibodies. Left, representative blots; right, quantitative data where NRG1 levels were normalized by synaptagmin1 (Syt1), and those in controls were taken as 1. n = 3 per genotype; *** Genotype F (1, 8) = 124.48, p < 0.001, two-way ANOVA. N, nucleus; C, cytoplasm; Syn, synaptosomes.
(B) Similar levels of LIMK1 in control and ctoNrg1 forebrains. Homogenates of individual control (lanes 1-4) and ctoNrg1 (5-8) mice were subjected to western blotting with antibodies against LIMK1 and α-tubulin. Left, representative blots; right, quantitative data where LIMK1 was normalized by α-tubulin. n = 4 per genotype; p > 0.05, t-test.
(C) Increased LIMK1 in P2 and synaptosomes of ctoNrg1 forebrains. Left, representative blots; right, quantitative data where LIMK1 in cytoplasm and P2 or synaptosomes were normalized by tubulin and Syt1, respectively. Levels in control mice were taken as 1. n = 3 per genotype; ** Genotype F (1, 12) = 17.73, p < 0.01, two-way ANOVA.
(D) Increased p-cofilin in P2 and synaptosomes of ctoNrg1 mice. Left, representative blots; right, quantitative data where p-cofilin was normalized by total cofilin. Data from controls were taken as 1. n = 3 per genotype; *** Genotype F (1, 8) = 26.68, p < 0.001, two-way ANOVA.
(E) Similar levels of LIMK1 and p-cofilin in P2 and Syn in aDox-treated control and ctoNrg1 forebrains. Left, representative blots; right, quantitative data where LIMK1 in cytoplasm was normalized by tubulin and that in P2 and synaptosomes by Syt1, p-cofilin was normalized by total cofilin; and those in controls were taken as 1; n = 3 per genotype; For LIMK1, Genotype F (1, 8) = 0.26, p > 0.05, two-way ANOVA; for p-cofilin, Genotype F (1, 8) = 0.00, p > 0.05, two-way ANOVA.
(F) HA-NRG1 was not detectable in forebrains of aDox-treated mice. Left, representative blots; right, quantitative data where NRG1 levels were normalized by Syt1, and those in controls were taken as 1; n = 3 per genotype; Genotype F (1, 8) = 1.57, p > 0.05, two-way ANOVA.

