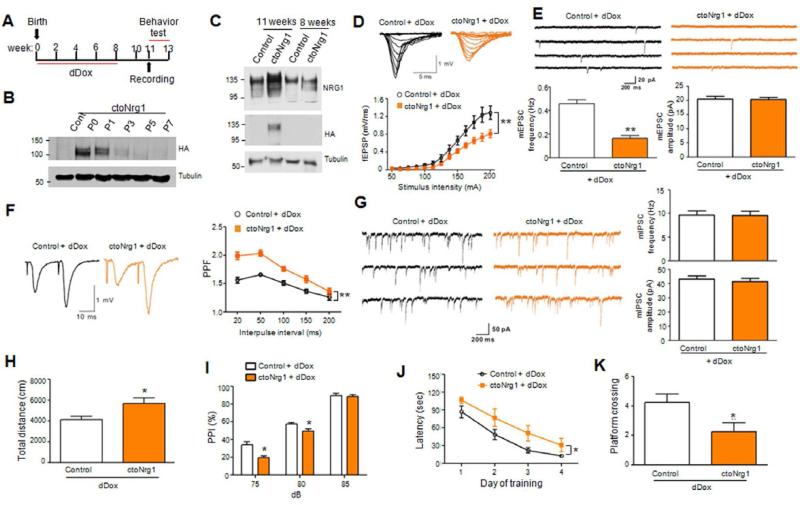
Figure 7. Adult NRG1 overexpression is sufficient to cause glutamatergic impairment and behavioral deficits.
(A) Diagram of dDox treatment and tests. Mice were fed with Dox-containing drinking water from P0 till 8 weeks of age, when Dox was omitted. Three weeks later, mice were subjected to analysis. Such treatment was designated as dDox for Dox treatment during development.
(B) Expression of the HA-NRG1 transgene in forebrains was not detectable after P3 in mice being treated by dDox.
(C) HA-NRG1 was not detectable in forebrains of dDox-treated mice at 8 weeks of age, but at 11 weeks of age (i.e., 3 weeks after dDox withdrawal).
(D) Depressed I/O curves in dDox-treated ctoNrg1 mice, compared to dDox-treated controls. Top, representative traces; bottom, quantitative data; n = 12 slices from 4 dDox-treated control mice, n = 11 slices from 5 dDox-treated ctoNrg1 mice; ** Genotype F (1, 273) = 40.77, p < 0.01, two-way ANOVA. Blank and yellow histograms/curves represent data from dDox-treated control and ctoNrg1 mice, respectively.
(E) Decreased mEPSC frequency, but not amplitude, in CA1 pyramidal neurons of dDox-treated ctoNrg1 mice, compared to controls. Top, representative traces; bottom, quantitative data; n = 9 cells from 3 dDox-treated control mice; and n = 10 cells from 4 dDox-treated ctoNrg1 mice; ** p < 0.01, t-test.
(F) Elevated PPF at SC-CA1 synapses in dDox-treated ctoNrg1 mice, compared to controls. Left, representative traces; right, quantitative data; n = 10 slices from 4 dDox-treated control mice; n = 10 slices from 5 dDox-treated ctoNrg1 mice; ** Genotype F (1, 90) = 70.21, p < 0.01, two-way ANOVA.
(G) Normal mIPSC in dDox-treated ctoNrg1 mice, compared to controls. Left, representative traces; right, quantitative data; n = 10 cells from 4 dDox-treated control mice; n = 12 cells from 4 dDox-treated ctoNrg1 mice; p > 0.05, t-test.
(H) Increased travel distance by dDox-treated ctoNrg1 mice in open field test for 30 min, compared to controls. n = 10 per genotype; * p < 0.05, t-test.
(I) Reduced PPI in dDox-treated ctoNrg1 mice, compared to controls. n = 10 per genotype; * Genotype F (1, 51) = 16.06, p < 0.05, two-way ANOVA.
(J) Increased latency of dDox-treated ctoNrg1 mice to reach the hidden platform in MWM, compared to controls. n = 10 per genotype; * Genotype F (1, 68) = 13, p < 0.05, two-way ANOVA.
(K) Reduced platform crossing by dDox-treated ctoNrg1 mice in MWM probe test, compared to controls. n = 10 per genotype; * p < 0.05, t-test.

