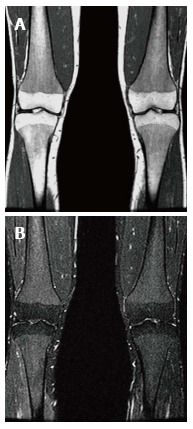
Figure 12.

Bone marrow infiltration. Coronal T1 WI (A) of the distal femora and proximal tibiae in a type 1 gaucher disease patient shows low signal intensity (SI) in the bone marrow which spares the epiphyses that demonstrate the normal fatty marrow SI. Coronal short tau inversion recover (STIR) (B) image demonstrates that the low SI on T1 becomes slightly high SI on STIR.
