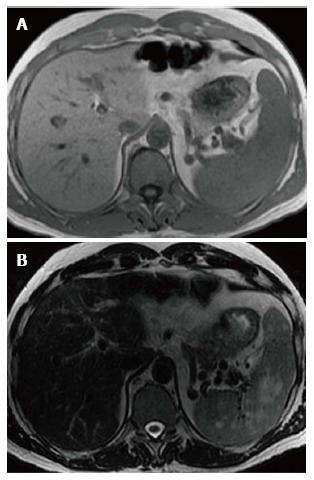
Figure 3.

Splenic mass on magnetic resonance. Axial T1WI (A) image shows no apparent abnormality within the spleen consistent with isointense signal intensity (SI) masses. Axial T2WI (B) image at the same level reveals multiple masses in the spleen to be high SI.
