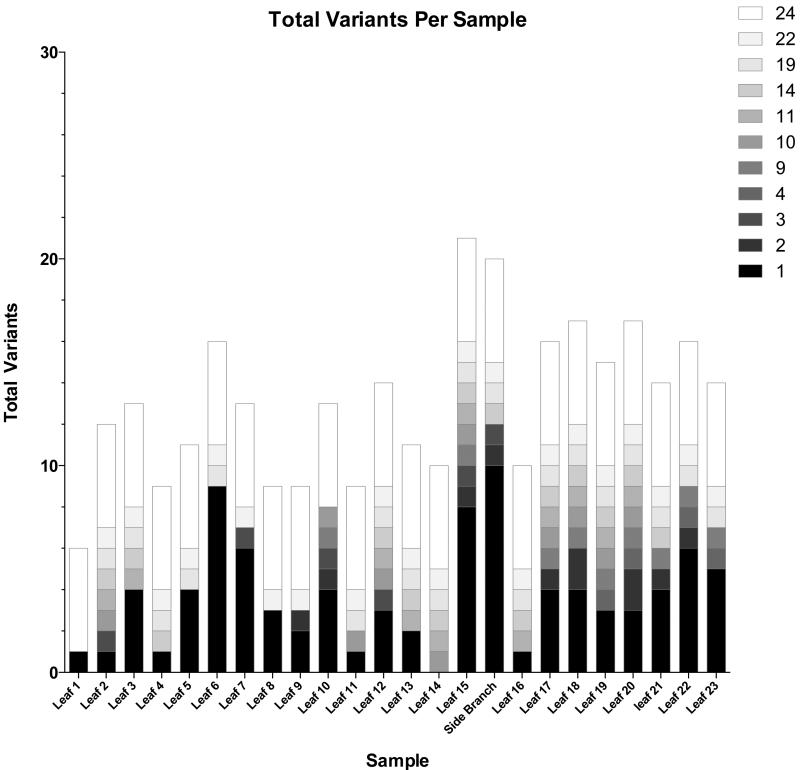
Figure 3.
A plot of the number of variants found in each sample. Variants in each column are organized into blocks that correspond to specific group sizes (number of samples that share the variants within each group). The actual number of leaf samples that share a variant is denoted by the color of the block. The X-axis denotes the total number of variants found in each sample and the samples are denoted in the y-axis.

