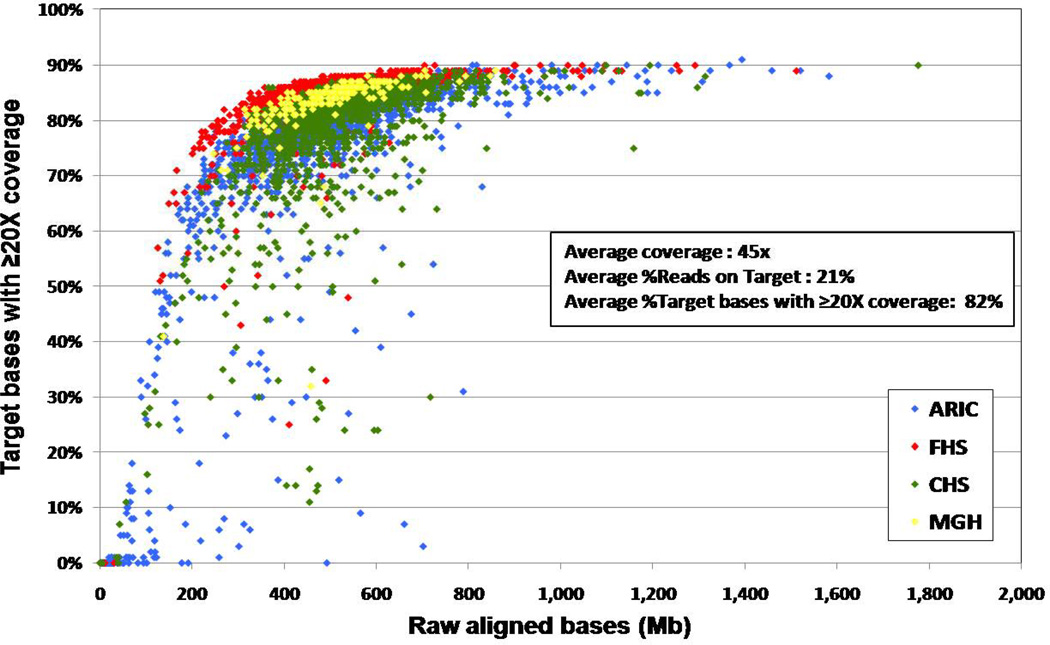
Figure 1.
Distribution of Targeted Sequence Coverage in 4,646 samples using SOLiD multiplexed capture sequencing. Each dot represents one sample. The x-axis represents the total depth of each sample (in terms of raw aligned bases), whereas the y-axis represents the proportion of targeted regions with more than 20× coverage. ARIC = Atherosclerosis Risk in Communities, CHS = Cardiovascular Health Study, FHS = Framingham Heart Study, MGH = Massachusetts General Hospital.

