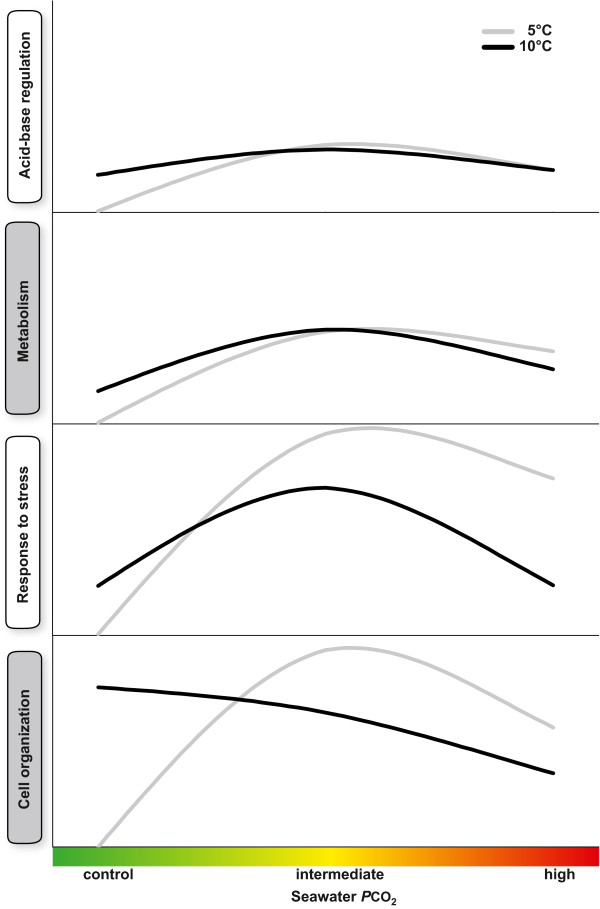
Figure 5.

Schematic description of the response of Hyas araneus to different exposure experiments for specific categories. For each treatment, log2-fold changes of all up-regulated transcripts within one specific category were summed and plotted as a line (gray line = 5°C; black line = 10°C). Scales are harmonized for all categories. The figure shows how acclimation to warming reduces the transcriptomic response of ‘cell organization’ and ‘response to stress’ to elevated CO2 tensions.
