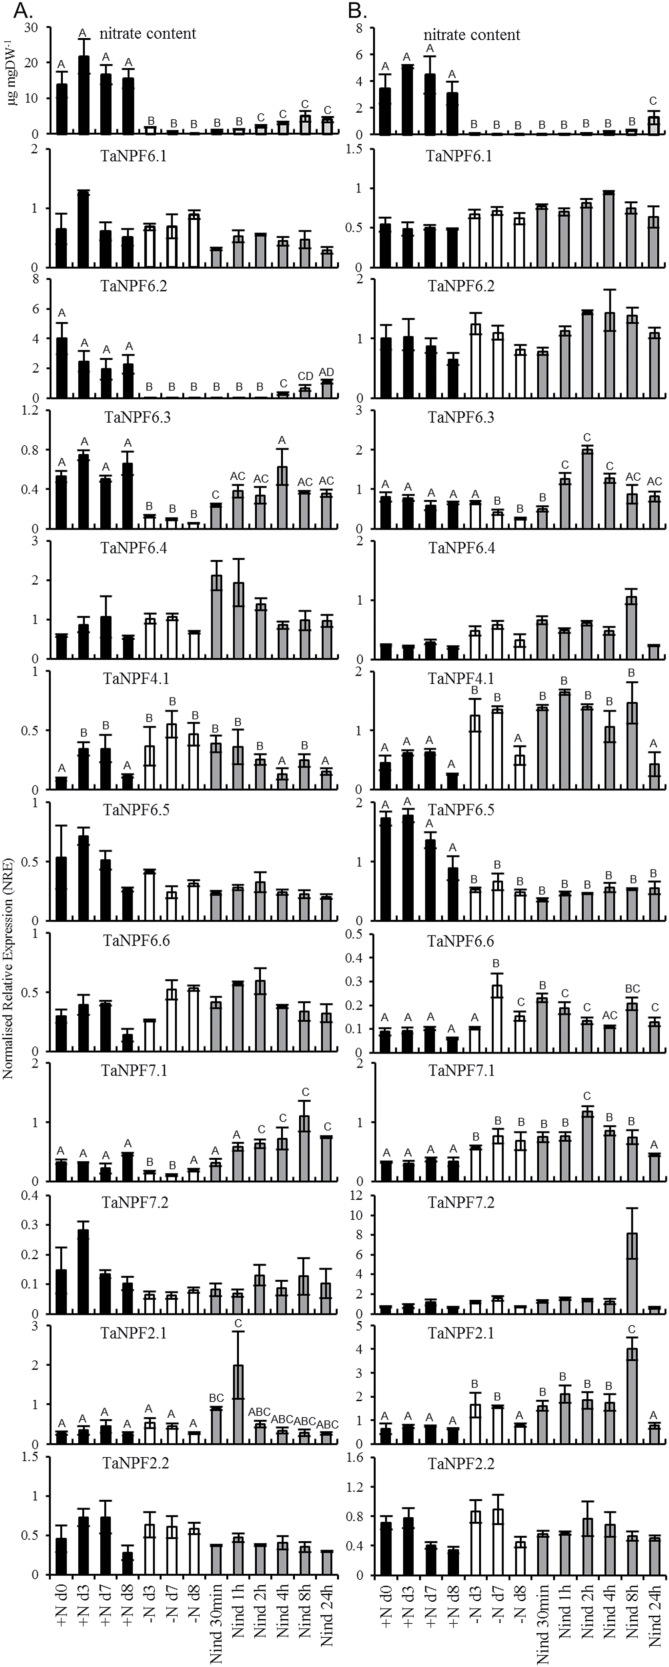
Fig. 3.
Influence of nitrate starvation and nitrate induction on the nitrate content and gene expression of wheat NPF genes in roots (A) and shoots (B) of young wheat plants. NRE, ‘Normalized Relative Expression’; black bars, + N treatment; white bars, – N-starvation; grey bars, nitrate induction. Each bar represents the mean ±SE of at least three biological replicates. Different letters on the top of the bars indicate significance of P < 0.05. Letters shared in common indicate no significant difference.

