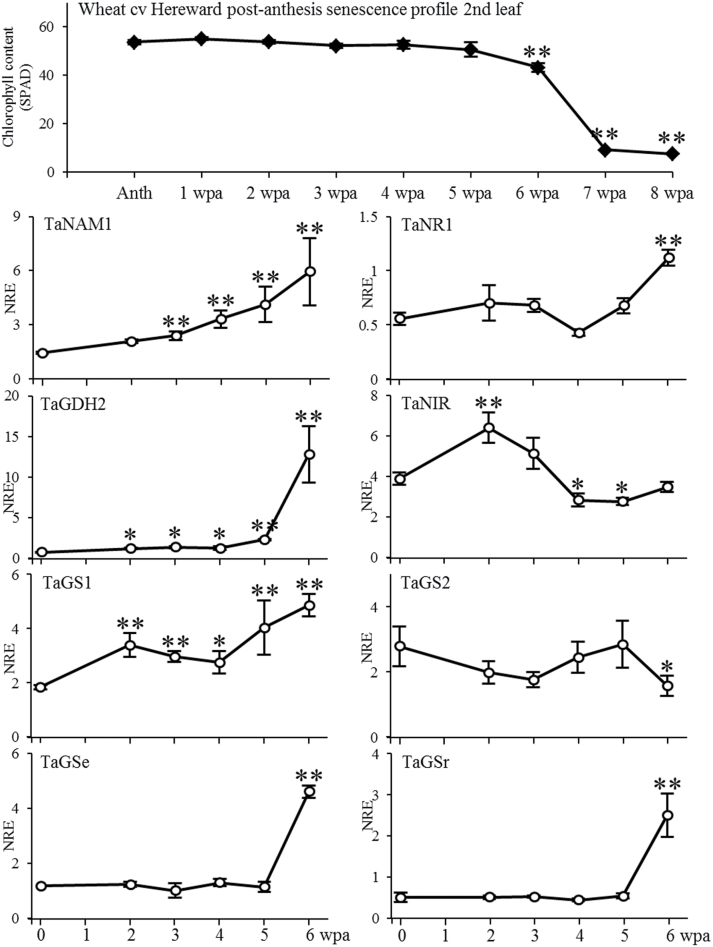
Fig. 5.
Expression analysis in relation to post-anthesis chlorophyll content/senescence in the second leaf of wheat. Real-time PCR expression analysis of NAC transcription factor (TaNAM), nitrate reductase 1 (TaNR1), nitrite reductase (TaNIR), glutamate dehydrogenase 2 (TaGDH2), glutamine synthetases TaGS1 (cytosolic), TaGS2 (plastidic), TaGse (cytosolic), and TaGSr (cytosolic). NRE, ‘Normalised Relative Expression’. Values are means ±SEM (n = 3). **, *, significantly different changes in time compared to anthesis (P < 0.01, P < 0.05, respectively). Anth, anthesis; wpa, weeks post-anthesis.

