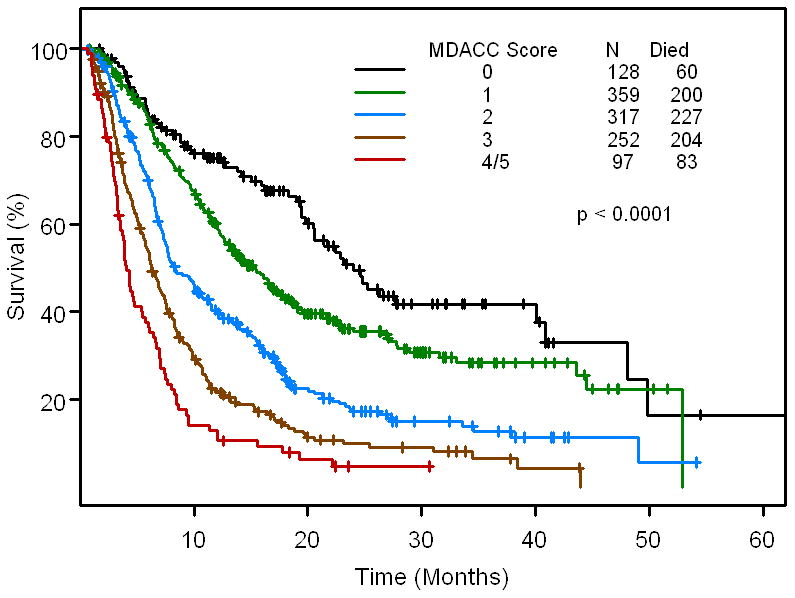
Fig 2B.

Kaplan - Meier survival curve for the 5 risk groups based on MDACC score (n=1,153 patients for whom all baseline data points were available). Ticks represent patients still alive and hence censored at last follow up.

Kaplan - Meier survival curve for the 5 risk groups based on MDACC score (n=1,153 patients for whom all baseline data points were available). Ticks represent patients still alive and hence censored at last follow up.