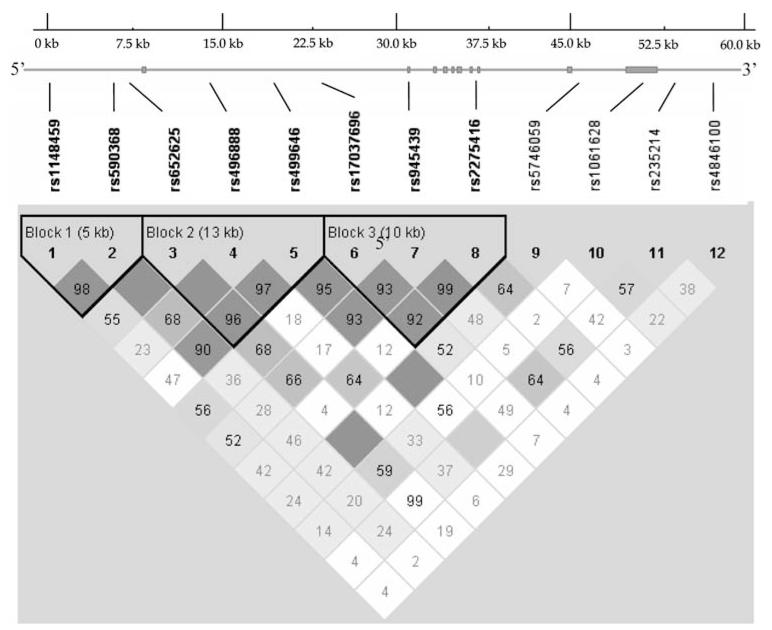
Fig. 1.
Gene structure and LD patterns for the TNRF2 gene. Exons are depicted as filled boxes. Positions of the 12 SNPs used in the association study are sketched. LD block structure, as depicted by Haploview, is shown in the bottom frame. The increasing degree of darkness from white to black represents the increasing strength of LD. Values for D′ = 1 are dark black boxes and D′ < 1 (indicated as original value multiple 100) are shown in the cells

