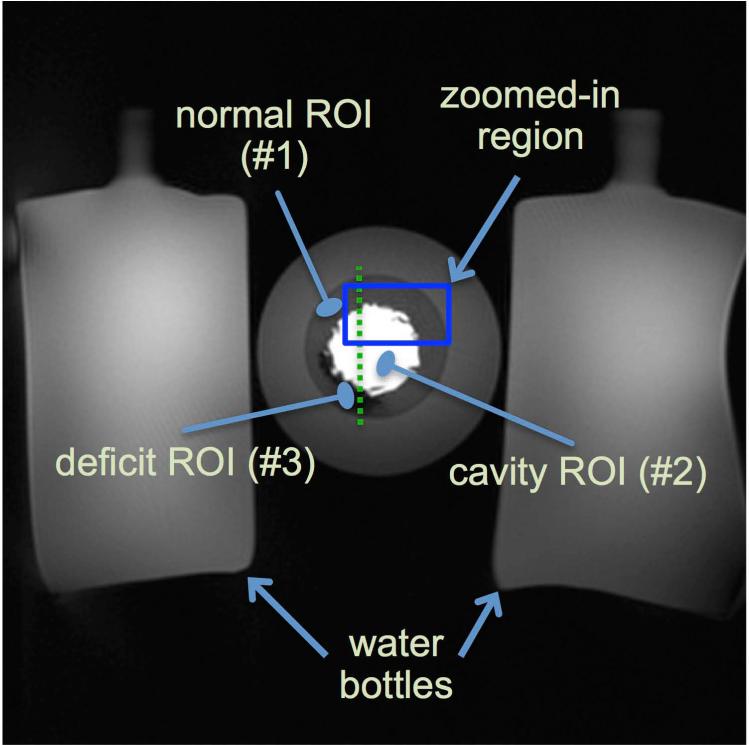
Figure 4.
Description of imaged MR gelatin-Gadolinium phantom with realistic signal intensity ratios, used to demonstrate robustness of projection imaging to Gibbs ringing. This “ground truth” image is acquired at 1.0x1.0 mm2 resolution using a SR-prepared FLASH radial pulse sequence with 384 readouts (projections). The ratio of the signal intensity in the cavity (ROI #2) to the normal region (ROI #1) is approximately 6 to 1 (range: 5.5-6.1). The cavity and normal regions were composed of a mixture of gelatin, saline, and contrast whereas the deficit region (ROI #3) contained almost no contrast agent. The T1 values ROIs #1, #2, and #3, are approximately 750 ms, 60 ms, and 1200 ms, respectively (estimated based on pixel-by-pixel T1 fitting using Cartesian data acquired separately with 6 different TIs). The highlighted box is the zoomed-in region shown in Fig. 5. The dotted line shows the location of the cut for the 1D profiles shown in Fig 5.

