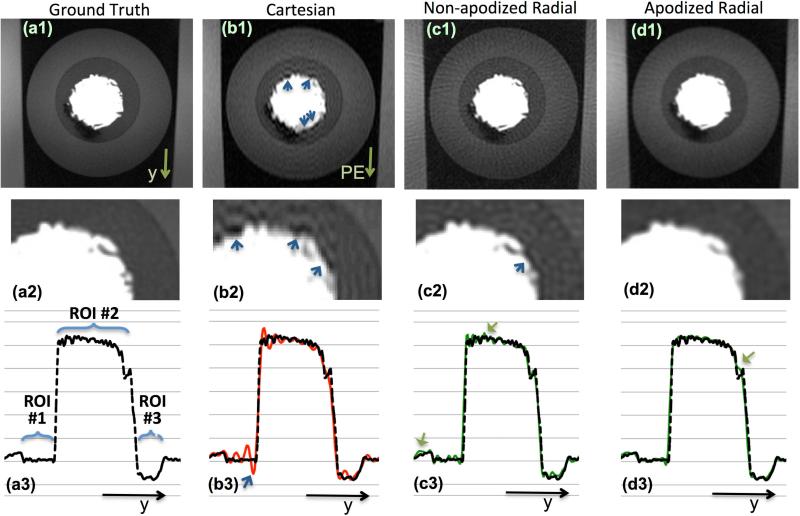
Figure 5.
Reconstructions results for the MR phantom in Fig. 4. The top row (a1-d1) shows zoomed-in reconstruction result; the middle row (a2-d2) shows images in the top row further zoomed-in to the box in Fig. 4; and the bottom row (a3-d3) are 1D cuts along the cut line in Fig. 4, with (a3) overlaid on (b3)-(d3) for comparison (ROIs in (a3) are defined in Fig. 4). Panels (a1)-(a3) show the “ground truth” image with 1.0 mm x 1.0 mm resolution. All other panels correspond to reconstructions with 77 readouts (256 samples each). Panels (b1)-(b3) shows the Cartesian reconstruction with 1.5x3.0=4.5 mm2 resolution (FOV size = 384x230 mm2); arrows in (b2) and (b3) point to DRAs. Panels (c1)-(c3) show the non-apodized radial reconstruction with 1.5x1.5=2.25 mm2 resolution; arrow in (c2) points to negligible DRA, and those in (c3) show mild streaking. Panels (d1)-(d3) show the apodized radial reconstruction (same apodizer as Fig. 2(d) and Fig. 3(c)) with 1.92x1.92=3.7 mm2 resolution (no DRAs, negligible streaking); arrow in (d3) points to over-smoothening of a small feature, which is a consequence of the lower resolution compared to the ground truth in (a3).

