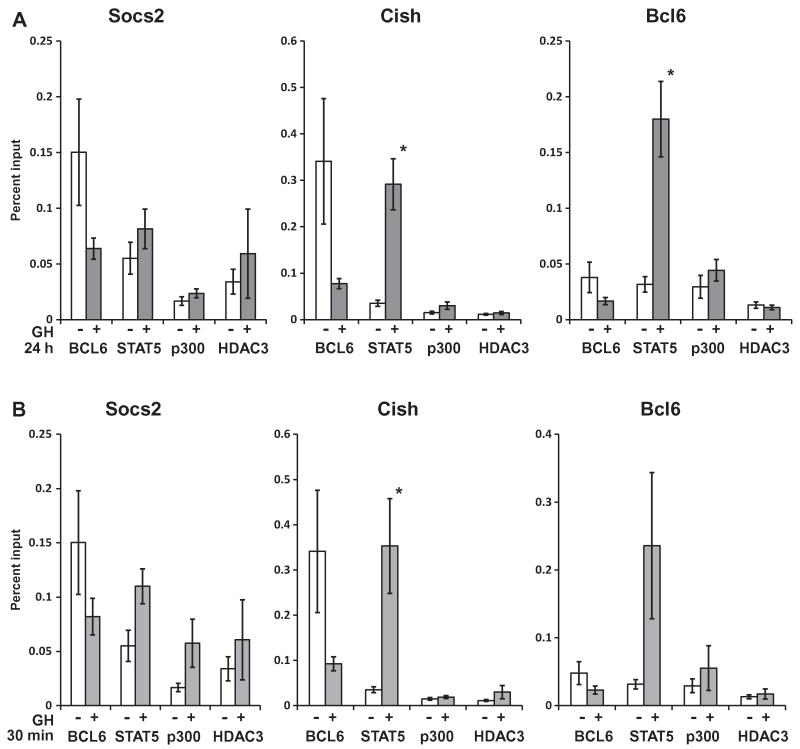
Fig. 4.
ChIP identifies p300 and HDAC3 on Socs2, Cish, and Bcl6. 3T3-F442A adipocytes were treated without (open bars) or with GH (gray bars) for (A) 24 h or (B) 30 min. ChIP was performed with antibodies against BCL6, STAT5, p300, or HDAC3. ChIP DNA was analyzed by qPCR with primers for the BCL6/STAT5 sites on Socs2, Cish, and Bcl6. Signals were normalized to input DNA from respective treatment conditions. Each bar shows the mean ± SE for 7 (BCL6 and STAT5) or 3 (p300 and HDAC3) independent experiments. Asterisks (*) indicate responses to GH that are statistically significant (P < 0.05).

