Fig. 5.
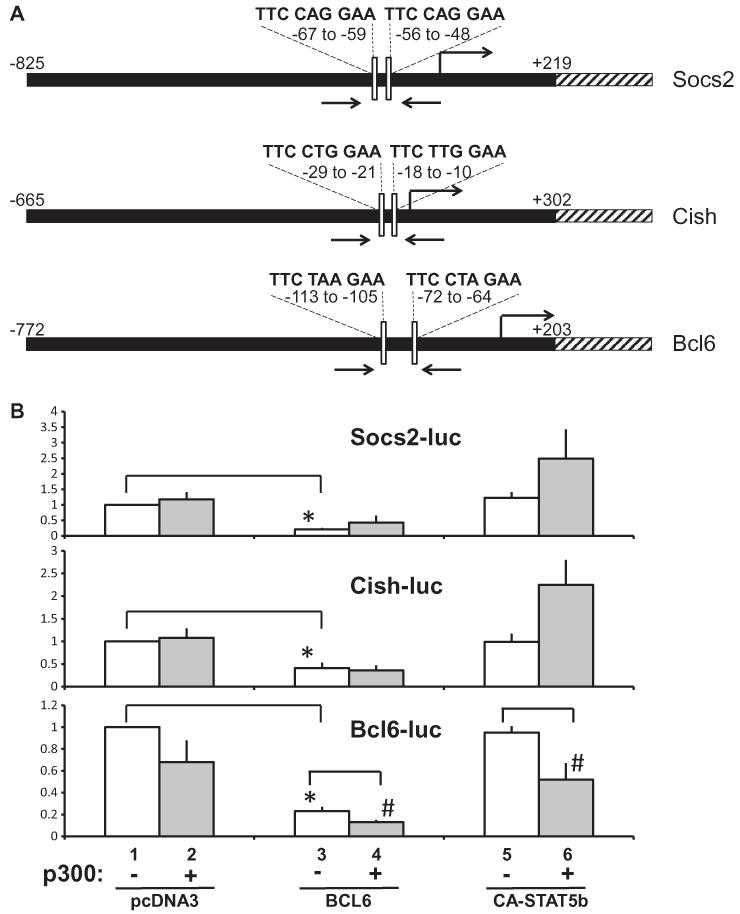
p300 represses transcription of the Bcl6 promoter. (A) Diagram of Socs2, Cish and Bcl6 genes showing relationship of genomic promoter sequences (black) driving luciferase (hatched) in reporter plasmids, predicted BCL6/STAT sites within occupied sequence (white bars), and location of ChIP primers (arrows). Predicted BCL6/STAT motifs are indicated above motif locations. Chromosomal locations are indicated in the legend of Fig. 2A. Diagrams are not to scale. (B) Plasmids for Socs2-luc (top), Cish-luc (middle) or Bcl6-luc (bottom) were transfected into 293T cells in the absence (bars 1–2) or presence of BCL6 (bars 3–4), or constitutively active STAT5b (CA-STAT5b) (bars 5–6). Plasmid for p300 (gray bars 2, 4, 6) or empty vector (pcDNA3, open bars 1, 3, 5) was co-expressed as indicated. Bars represent means + SE for 5 (Socs2, Cish) or 6 (Bcl6) independent experiments. Asterisks (*) indicate that BCL6 (bar 3) significantly (P < 0.05) represses expression compared to basal luciferase (bar 1). Hatch signs (#) show responses to p300 that are significantly (P < 0.05) different from the respective pair in the absence of p300.

