Figure 2.

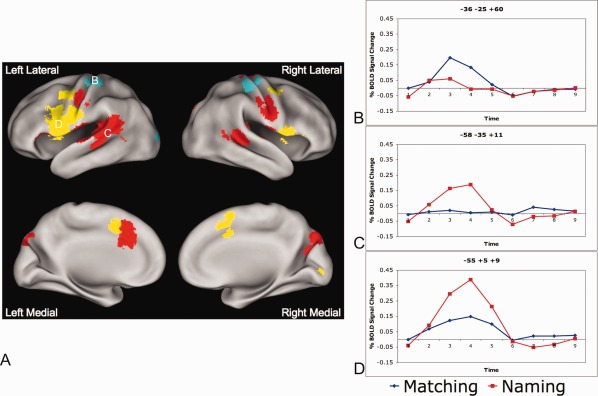
Task by timecourse effects. A: Regions obtained from a whole brain task (matching vs. naming) by timecourse‐repeated measures ANOVA. Blue regions show more activity for matching than naming (in a statistical test of reliability). Red regions show activity in the naming task but have no significant activity in the matching task > 0.05% BOLD signal change. Yellow regions are active in both tasks, but have more activity in the naming relative to matching tasks. B: Timecourses for an exemplar blue (matching > naming) region (left finger sensorimotor region: −36, −28, and 57). Timecourse for matching is shown in blue and for naming in red. C: Timecourses for an exemplar red (naming only) region (left auditory cortex: −56, −26, and 10). Timecourses for matching shown in blue and naming in red. D: Timecourses for an exemplar yellow (naming > matching) region (left IFG: −52, 2, and 10). Timecourses for matching shown in blue) and naming in red.
