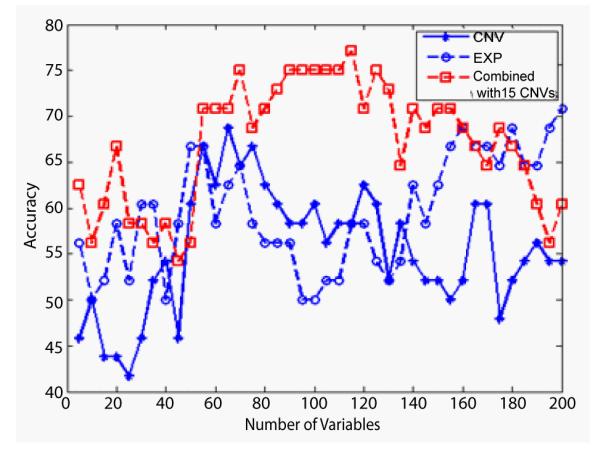
Figure 3.

The classification accuracies of GA and GB subtypes by using CNVs data (star), gene expression data (circle) and the combined data of the two (square), corresponding to different numbers of IVs from 5 to 200. Note that the combined analysis can reach higher accuracies than either individual analysis.
