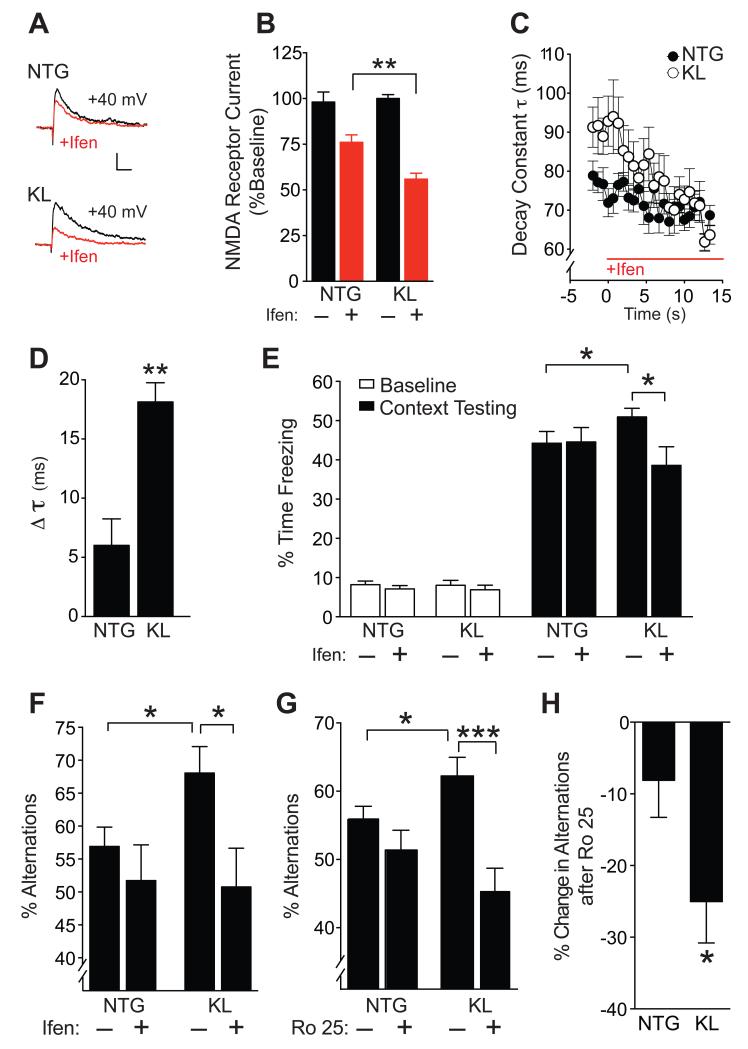
Figure 7. Treatment with GluN2B selective antagonists blocks klotho effects on NMDAR currents and cognition.
(A,B) Representative traces (A) and quantitation (B) of isolated NMDAR EPSCs in the presence of NBQX (10 μm) at baseline (black) and following perfusion with ifenprodil (Ifen., 3 μM) (red) in the same slices. Number of slices/mice: NTG 6/3, KL 5/3. Two-way repeated measures ANOVA: ifenprodil effect p<0.0001, ifenprodil by KL interaction p<0.05. (C) Time course of NMDAR EPSC decay constant following ifenprodil perfusion in each genotype. Mixed model ANOVA: p<0.0001 for KL vs NTG genotype by time effect. (D) Change in decay constant (τ) between 0-10 min after initiation of ifenprodil treatment in NTG and KL slices. Number of slices/number of mice: NTG 7/3, KL 5/3. (E-F) Mice (n=8-19 per group) received a single i.p. injection of vehicle (−) or ifenprodil (5 mg/kg) 10 min before training in a fear conditioning paradigm or testing in the Y-maze. (E) Percent time mice (age 5-7 months) spent freezing at baseline and 24 h after context training in a fear conditioning task. Two-way ANOVA: ifenprodil by KL interaction p<0.05. (F) Percent alternations among Y-maze arms that mice (age 10-12 months) showed during 3 min exploration. Two-way ANOVA: ifenprodil by KL interaction p<0.09. (G-H) Mice (n=13-19 per group, age 3-5 months) received a single i.p. injection of vehicle (−) or Ro 25-6981 (Ro 25; 5 mg/kg) 30 min before testing in Y-maze. (G) Percent alternations among Y-maze arms. Two-way ANOVA: Ro 25 by KL interaction p<0.05. (H) Percent decrease in alternations following Ro 25 treatment in NTG and KL mice. *p<0.05, **p<0.01, ***p<0.001 vs. NTG or as indicated by brackets by t-test (B, D, H) or Bonferroni-Holm test (E, F, G). See also Figure S6. Data are means ± SEM.

