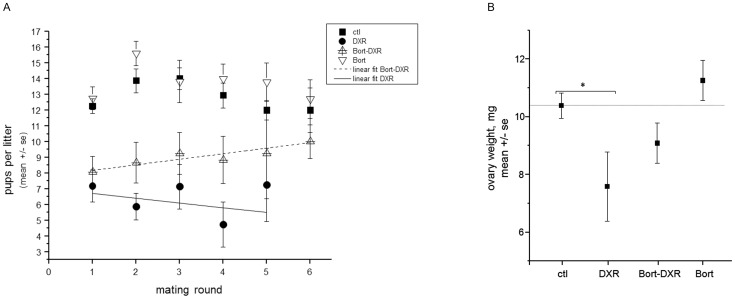
Figure 5. Bort pretreatment increases pup number per litter and ovarian weight following DXR.
Number of pups birthed in each litter were counted and weighed for each treatment group. A. Plot depicts the mean number of pups per litter (± SE) for each litter number for each dam treatment group. Linear fit for Bort-DXR has a slope of 0.35±0.06 SE, DXR linear slope = −0.31±0.04. *p = 0.033 for DXR vs. Bort-DXR, two-way ANOVA. Only 1 DXR-treated mouse achieved a sixth litter; the point is not plotted as no error can be calculated. B. Graph plots mean weight of ovary (mg) ± SE for each treatment group at 8 months of age [ctl = 10.4±0.4 mg (n = 36), DXR = 7.6±1.2 mg (n = 8), Bort-DXR = 9.1±0.7 mg (n = 22), Bort = 11.3±0.7 mg (n = 32)]. DXR induced a significant reduction in ovary weight (p<0.05, one-way ANOVA). Bort-DXR and Bort treatment groups were not significantly different from control.

