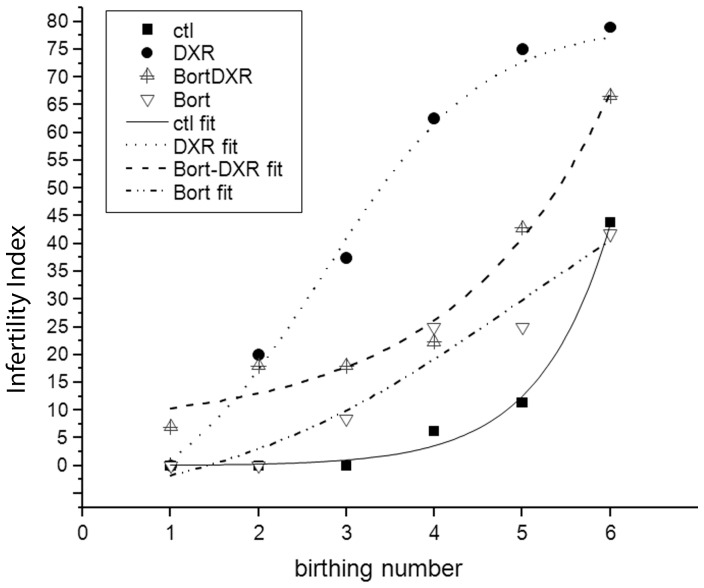
Figure 7. Bort pretreatment improves the infertility index following DXR treatment.
Plot represents the ‘infertility index’ plotted as the percentage of surviving animals from each treatment group that fail to achieve the next birth as a function of birth (litter) number. Symbols correspond to control, DXR, Bort –DXR and Bort treatment groups as indicated. DXR points in the linear range were statistically different from Bort-DXR, Bort, and control (p<0.05, one-way ANOVA).

