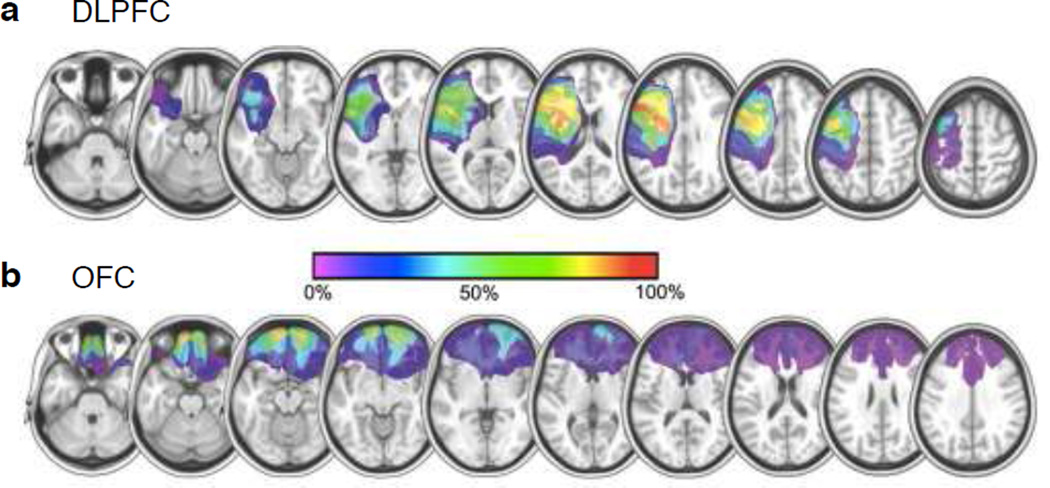
Figure 1.
Lesion reconstruction. Structural MRI slices illustrating the lesion overlap across the two patient groups. (a) For the DLPFC group (n = 6), mean lesion volume was 125.76 cm3 and maximal cortical lesion overlap (>50%) was in the Brodmann areas 6, 8, 9 and 46, encompassing portions of the middle and superior frontal gyri in all patients. All dorsolateral prefrontal cortex lesions (5L; 1R) were shown overlapped to the left hemisphere for comparison purposes. For lateralized and individual reconstruction see Supplementary Fig. 1-2 and Supplementary Table 1. (b) For the orbitofrontal cortex group (n = 7), mean lesion volume was 72.29 cm3 and maximal cortical lesion overlap (>50%) was in Brodmann areas 10, 11, and 47, centered in the OFC and including portions of inferior and superior frontal gyri in some patients. See Online Methods for details.

