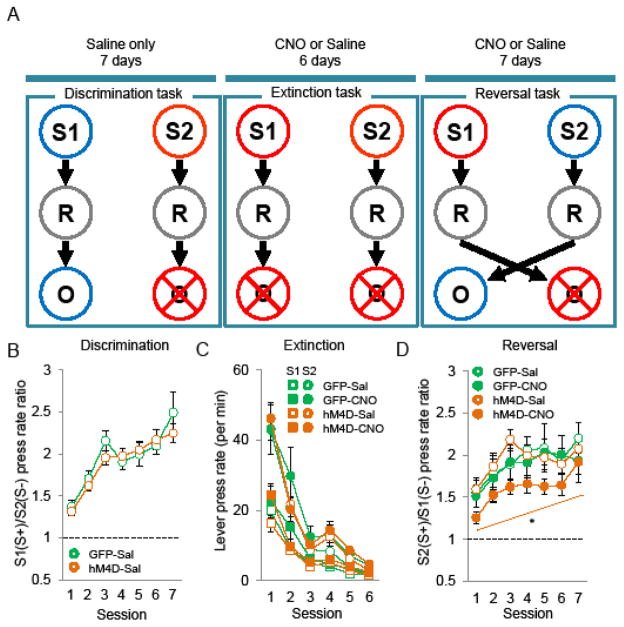
Figure 2.
Effect of decreased MD activity on extinction and reversal learning task. A, Schematic drawing of the experiment design. Abbreviations: Visual stimulus 1 (S1), visual stimulus 2 (S2), lever-press response (R), outcome (milk) (O). B, Discrimination task, ratio between mean S+ and S− response rate (±SEM) (GFP-Sal n=15, hM4D-Sal n=29). C, Extinction task. mean lever press performed per minute (±SEM) during S+ and S− presentations (GFP-Sal n=8, GFP-CNO n=7, hM4D-Sal n=15, hM4D-CNO n=14). D, Reversal task, ratio between mean S+ and S− response rate (±SEM) (GFP-Sal n=8, GFP-CNO n=5, hM4D-Sal n=13, hM4D-CNO n=15).

